Figures & data
Figure 1. SLLN-15 inhibited the growth of breast cancer cells in vitro and in vivo. (a) Structure of SLLN-15. (b) MDA-MB-231 and BT-20 cells were seeded and treated with the indicated concentration of SLLN-15 or DMSO for 7 days. Long-term cell viability of a panel of breast cancer cell lines was measured via clonogenic formation assay. The number of the colonies in each group are quantified as mean± SEM (*, p < 0.05, n = 3). ER: estrogen receptor; PR: progesterone receptor. (c) MDA-MB-231 and BT-20 cells were seeded and treated with the indicated concentration of SLLN-15 or DMSO for 24 h. Short-term cell viability was measured by the MTT assay. Data are presented as mean ± SEM, n = 3. (d and e) Graphs show the primary tumor volume from the BALB/c mice implanted with mouse mammary carcinoma 4T1 cells (left) and SCID mice implanted with MDA-MB-231 cells (right) treated with either vehicle or SLLN-15 (30 mg/kg), 3 times a week for 40 days. Quantification of primary tumor volumes measured at the indicated time points (d) and the weight of primary tumor at time of sacrifice (e) (mean ± SEM, n = 8 BALB/c mice or SCID mice, *p < 0.05). (f) Representative images of H&E staining of lung tissues (left; scale bar: 500 nm) and quantification of the mean number of surface lung metastases from mice implanted with 4T1 or MDA-MB-231 cells treated with either vehicle or SLLN-15 (30 mg/kg) (mean ± SEM, n = 8, *p < 0.05).
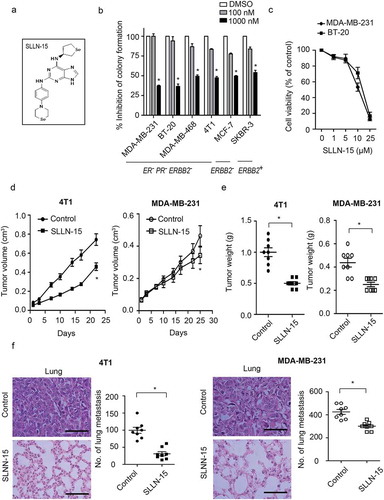
Figure 2. SLLN-15 induced autophagy in breast cancer cells. (a) Representative images of primary tumor tissues from MDA-MB-231 and 4T1 xenografts models treated with vehicle or SLLN-15 (30 mg/kg), immunohistochemically stained with LC3B and ATG12 antibodies (scale bar: 500 nm). (b) MDA-MB-231 and BT-20 cells were treated with either DMSO or the indicated concentration of SLLN-15 for 24 h, lysed, immunoblotted with antibodies against LC3B and GAPDH (internal control). (c) MDA-MB-231 and BT-20 cells were treated with either DMSO or 10 μM SLLN-15 for 24 h, fixed and stained with anti-LC3 antibody (green) and with DAPI (blue) on top (scale bar: 20 μm) and quantification of the number of LC3 puncta per cells (mean ± SEM, n = 30 cells from three independent experiments, *p < 0.05) at the bottom. (d) Autophagy measured by transmission electron microscopy in MDA-MB-231 cells and BT-20 cells treated with 10 μM of SLLN-15 for 24 h. N, nucleus; av, autophagic vacuoles; ap, autophagosome; pg, phagophore (scale bar: 100 nm).
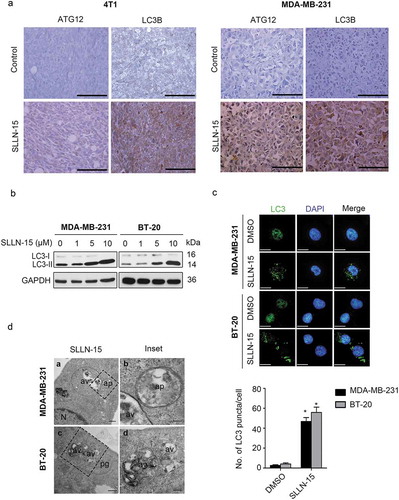
Figure 3. SLLN-15 promoted autophagy flux in breast cancer cells. (a) MDA-MB-231 and (b) BT-20 cells were transiently transfected with mCherry-GFP tandem fluorescent-tagged LC3 (mCherry-GFP-LC3) for 24 h and treated with either DMSO or 10 μM SLLN-15 for another 24 h. Then, cells were fixed and stained with DAPI (blue); scale bar: 20 μm (top). Quantification of the number of fluorescent puncta exhibiting green (GFP) or red (mCherry) fluorescence per cells (bottom) (mean ± SEM, n = 5 cells, *p < 0.05). (c) Lysate from MDA-MB-231 and BT-20 cells treated with DMSO or 10 μM SLLN-15 alone or in combination with 10 μM chloroquine (CQ) for 24 h were immunoblotted with antibodies against LC3B and ACTB/β-actin (internal control). (d) MDA-MB-231 and (e) BT-20 cells were treated with either DMSO or 10 μM SLLN-15 in the presence or absence of CQ for 24 h, fixed and stained with anti-LC3 antibody (green) and with DAPI (blue); scale bar: 20 μm (left). Quantification (right) shows the average number of LC3 puncta per cells (mean ± SEM, n = 30 cells from 3 independent experiments, *p < 0.05).
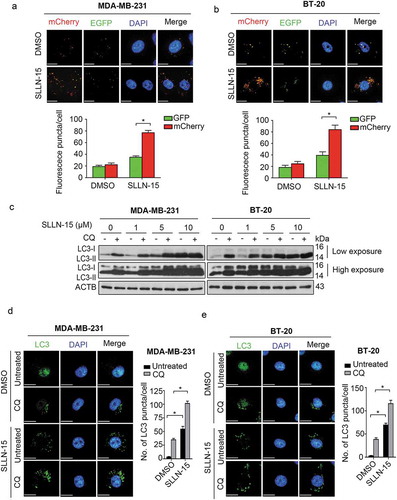
Figure 4. SLLN-15 induced autophagy by inhibiting AKT-MTOR signaling proteins. (a) MDA-MB-231 and BT-20 cells were treated with either DMSO or the indicated concentrations of SLLN-15 for 24 h, lysed, immunoblotted with anti-p-S473-AKT, anti-AKT, anti-p-S2448-MTOR, anti-MTOR, anti-p-T421/S424-RPS6KB, anti-RPS6KB, anti-p-S240/244-RPS6, anti-RPS6, anti-p-T37/46-EIF4EBP1 and anti-EIF4EBP1 and ACTB/β-actin (internal control) antibodies. (b) BT-20 cells were transfected with an empty vector (pcDNA3-HA) or pcDNA3-HA-AKT plasmid for 48 h, and then cells were treated with 10 μM of SLLN-15 for another 24 h and immunoblotted with antibodies against p-S473AKT, anti-AKT, p-S2448-MTOR, MTOR, p-T421/S424-RPS6KB, RPS6KB, p-T37/46-EIF4EBP1, EIF4EBP1, LC3B and anti-GAPDH as an internal control. Indicated ratios were calculated using ImageJ software. (c) MDA-MB-231 and (d) BT-20 cells were transfected with an empty pcDNA3-HA (vector) or pcDNA3-HA-AKT plasmid for 48 h, and then cells were treated with 10 μM of SLLN-15 for another 24 h, fixed and stained with anti-LC3 antibody (green) and with DAPI (blue); scale bar: 20 μm (left); quantification on the right showed average number of LC3 puncta per cells (mean ± SEM, n = 30 cells from 3 independent experiments, *p < 0.05.
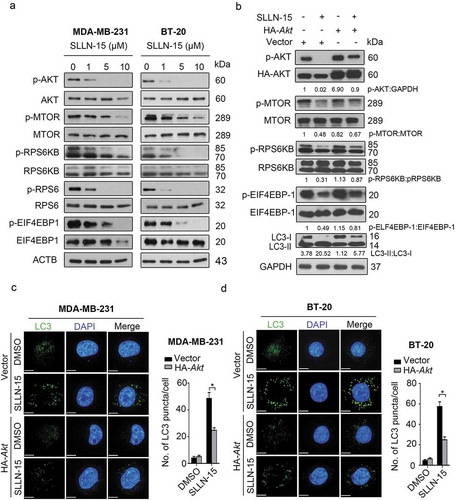
Figure 5. Inhibition of autophagy repressed the antiproliferative effect of SLLN-15 in breast cancer cells. (a and b) BT-20 cells were transfected with siRNA against control, BECN1, ATG5 or ATG7 (50 nM) for 48 h, and then cells were treated with either DMSO or 10 μM of SLLN-15 for another 24 h. (a) Cells were lysed and immunoblotted with antibodies against BECN1, ATG5, ATG7 and anti-GAPDH as an internal control; (b) the numbers of cells were counted by hemocytometer. The cell viability are presented as % of DMSO treated cells (mean± SEM, * p < 0.05, n = 3) (Cc MDA-MB-231 and BT-20 cells were treated with either DMSO or the indicated concentrations of SLLN-15 alone or in combination with 2 mM 3-methyladenine (3-MA) for 24 h, lysed and immunoblotted with antibodies against LC3B and ACTB/β-actin (internal control). (d) The short-term cell viability of MDA-MB-231 and BT-20 cells treated with the indicated concentration of SLLN-15 or DMSO alone or in combination with 2 mM 3-MA for 24 h was evaluated by the MTT assay. Data are presented as mean ± SEM, n = 3. (e) The long-term cell viability of MDA-MB-231 and BT-20 cells treated with the indicated concentration of SLLN-15 or DMSO alone or in combination with 3-MA for 7 days was measured via clonogenic forming assay. The number of the colony formation in each group is quantified as mean± SEM (*, p < 0.05, n = 3).
Figure 6. SLLN-15 induced cytostatic autophagy to inhibit the proliferation of breast cancer cells. (a) MDA-MB-231 and BT-20 cells were seeded and treated with 10 μM of vorinostat, SLLN-15 or DMSO for 24 or 48 h. Short-term cell viability was measured by the MTT assay. Data are presented as mean ± SEM, n = 3. (*p < 0.05). (b) MDA-MB-231 and BT-20 cells were treated with 10 μM of vorinostat, SLLN-15 or DMSO for 24 or 48 h, lysed, immunoblotted with antibodies against cleaved-PARP1, cleaved-CASP3 and GAPDH (internal control). (c) MDA-MB-231 cells and BT-20 cells were treated with indicated concentrations of SLLN-15 or DMSO for 24 h. The DNA contents was stained by PI and analyzed by flow cytometry. The graph indicates the percentage of cells at G1 phase (2N), S phase (2N-4N), G2/M phase (4N). (d) MDA-MB-231 and BT-20 cells were treated with either DMSO or the indicated concentration of rapamycin or SLLN-15 for 24 h. Short-term cell proliferation was measured by the BrdU incorporation assay. Data are presented as mean± SEM, n = 3. (*p < 0.05). (e) MDA-MB-231 and BT-20 cells were treated with either DMSO or the indicated concentration of SLLN-15 or rapamycin for 24 h, lysed and immunoblotted with antibodies against p-T421/S424-RPS6KB, p-S473-AKT, p-S240/244-RPS6, LC3B and GAPDH (internal control.
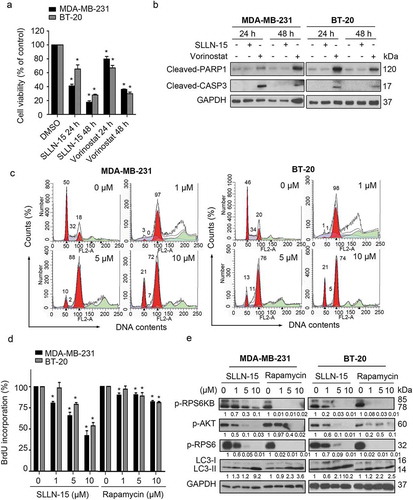
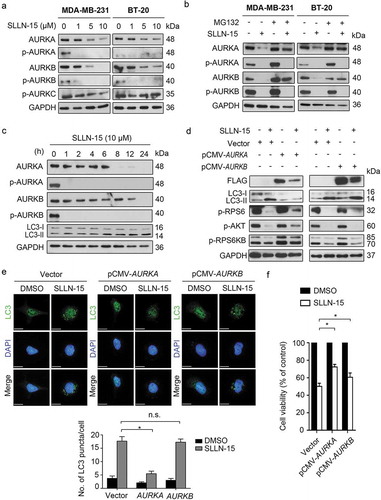
Figure 7. SLLN-15 induced autophagy through downregulation of AURKA-AKT-MTOR axis. (a) MDA-MB-231 and BT-20 cells were treated with either DMSO or indicated concentration of SLLN-15 for 24 h, lysed, immunoblotted with antibodies against AURKA/B/C, AURKA, AURKB and GAPDH (internal control). (b) Lysates from cells treated with either DMSO or 10 μM of SLLN-15 alone or pretreated with MG-132 (2 μM, 24 h) for 24 h were immunoblotted with antibodies against p-AURKA/B, AURKA, AURKB and GAPDH (internal control). (c) BT-20 cells were treated with either DMSO or 10 μM of SLLN-15 for the indicated time, lysed and immunoblotted with anti-p-AURKA/B, anti-AURKA, anti-AURKB, LC3B and GAPDH (internal control) antibodies. (d) 293T cells were transfected with an empty vector (pCMV), pCMV-AURKA or pCMV-AURKB plasmids for 48 h, and then cells were treated with 10 μM of SLLN-15 for another 24 h and immunoblotted with antibodies against FLAG-tag, LC3B, p-S240/244-RPS6, p-S473-AKT, p-T421/S424-RPS6KB and anti-GAPDH as an internal control. (e) 293T cells transfected with an empty vector (pCMV), pCMV- AURKA or pCMV-AURKB plasmids for 48 h were then treated with either DMSO or SLLN-15 (10 μM) for 24 h, fixed and stained with anti-LC3 antibody (green) and with DAPI (blue); scale bar: 20 μm (left); quantification on the right shows the average number of LC3 puncta per cell (mean ± SEM, n = 30 cells from 3 independent experiments, *p < 0.05). (f) 293T cells were transfected with an empty vector (pCMV), pCMV-AURKA or pCMV-AURKB plasmids for 48 h, and then cells were treated with either DMSO or 10 μM of SLLN-15 for another 24 h. Cell viability was measured by the MTT assay. Data are presented as mean ± SEM, n = 6, *p < 0.05).