Figures & data
Figure 8. Proposed model for molecular signaling involved in radiation-induced autophagy. Radiation exposure results in the generation of numerous reactive oxygen species (ROS) mainly via mitochondrial potential disturbance. The formed ROS may cause damage to the macromolecules (primarily DNA, proteins and lipids) leading to protein misfolding and unfolding, resulting in ER stress. This stress is sensed through the UPR sensor HSPA5/GRP78 (which binds to the unfolded proteins) causing instigation of UPR through predominant activation of the EIF2AK3 and ERN1 branches of the UPR. The UPR results in the induction of autophagy in radiation-exposed conditions. This radiation-induced autophagy, which is dependent on ROS production and UPR for its induction, is a pro-survival stress response (which may be due to efficient recycling of damaged cellular cargos generated upon radiation exposure).
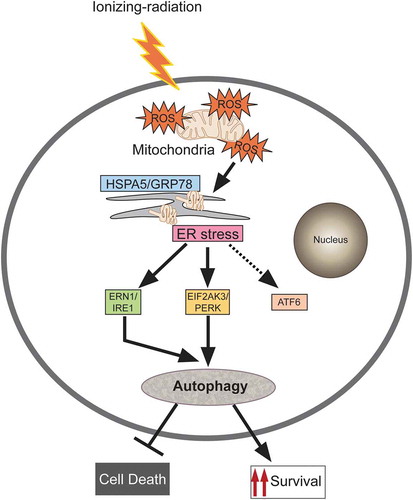
Figure 1. Radiation induces autophagy in RAW 264.7 cells. (a) RAW 264.7 cells were exposed to different doses of IR ranging from 0 to 10 Gy, 24 h post-irradiation cells were counted, and relative growth was calculated with respect to unirradiated control cells. The graph represents growth of irradiated cells relative to unirradiated control. LD50 of these cells was found to be 2.5 Gy. Data is representative of 3 independent experiments. (b) RAW 264.7 cells were exposed to 2.5 Gy IR and processed for growth inhibition kinetics, cell viability and metabolic viability. Cells were counted for growth inhibition or processed by sulphorhodamine-B (SRB) or MTT for cell and metabolic viability respectively after 12 and 24 h. For the clonogenic assay, cells were exposed to 2.5 Gy radiation and were incubated at 37°C to form colonies. Upper left, and right panel represents growth inhibition and cell viability (by SRB assay) whereas lower left and right panel represent metabolic viability and clonogenicity. (c) Upper left panel: A bar graph showing results from ANXA5-PI assay in irradiated vs normal cells. Upper right panel: A bar graph showing mean fluorescence intensity of propidium iodide uptake in irradiated samples as compared to unirradiated control cells using flow cytometry at 12 and 24 h post-IR exposure. Lower Panel: Western blot analysis of cell lysate obtained at 12 and 24 h post-irradiation. Blots were probed with intrinsic apoptosis marker, cleaved CASP3, GAPDH was used as loading control. (d) Lysates from RAW 264.7 cells exposed to increasing IR doses ranging from 0–7.5 Gy were resolved by SDS-PAGE and blotted onto PVDF membranes, followed by immunoblotting with LC3- and SQSTM1-specific antibodies. Each blot is representative of 3 independent experiments. The graphs show quantitation of band intensities (relative to ACTB) from 3 independent experiments. (e) The kinetics of autophagy induction in RAW 264.7 cells was explored by Western blot analysis of LC3-II levels (relative to ACTB) in whole cell lysates. The graph shows quantification of band intensities (relative to ACTB) from 3 independent experiments. (f) In order to study autophagic flux, cells were irradiated, and BafA1 (100 nM) was added 2 h before harvesting. Samples were analyzed after 12 and 24 h. The graph shows quantification of band intensities (relative to ACTB) from 3 independent experiments. (g) EGFP-LC3 puncta were analyzed through confocal microscopy (63X magnification) in irradiated RAW 264.7 cells. Briefly, after 24 h post-transfection with pEGFP-LC3, RAW 264.7 cells were treated with 2.5 Gy ionizing radiation and images were captured 12 h post-irradiation. Puncta were counted using ImageJ from at least 3 fields per experiment. Arrows indicate puncta post-irradiation. Also, the difference in morphology of irradiated cells can be seen in the represented image. The graph on the right represents EGFP-LC3-positive puncta per cell after radiation exposure as compared to control (**P < 0.01, IR vs control). (h) Electron microscopy-based detection of autophagosome in RAW 264.7 cells. Electron micrographs of control and radiation-exposed cells were taken at 12 h post-irradiation. Arrowhead in the representative micrograph shows the autophagosome. Autophagosomes were counted manually from at least 3 fields per experiment. The graph on the right represents an average number of autophagosomes/cell after radiation exposure as compared to control (*P < 0.05, IR vs control). Molecular mass is represented by kDa (kilodalton).
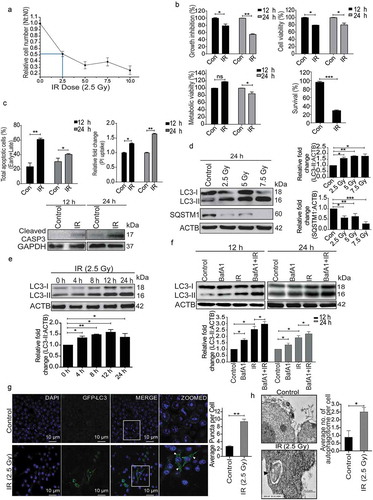
Figure 2. Radiation induces oxidative stress in RAW 264.7 cells. (a) Kinetics of radiation-induced oxidative stress in RAW 264.7 cells. The line graph shows relative fold change in fluorescence intensity for intracellular ROS production with respect to non-irradiated control cells after DCFDA staining (10 µM) in response to radiation exposure (2.5 Gy). *P < 0.05, at 0 h and **P < 0.01, at the 12 h post-IR respectively. (b) Effect of ROS scavenger NAC (freshly prepared, given 1 h prior irradiation) on the IR-induced oxidative burst. The values shown are relative to unirradiated control (considered as zero). The 0 h time point represents samples processed immediately after radiation. (c) Radiation-induced changes in autophagy levels are ROS-dependent. Immunoblots of total protein lysates from control, IR and NAC+IR samples harvested at 12 h or 24 h post-irradiation and probed with the indicated specific antibodies. For LC3 blotting, Sigma-Aldrich, L7543 was used. Each blot is representative of 3 independent experiments. The graph shows quantitation of band intensities (relative to ACTB) from 3 independent experiments.
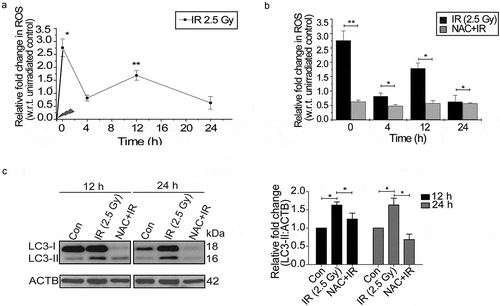
Figure 3. Radiation induces ER stress in RAW 264.7 cells. (a) Kinetics of UPR induction after radiation exposure was studied through the expression profile of the UPR marker, HSPA5. The experiment was performed at least 3 independent times. The graph shows quantification of band intensities (relative to ACTB) from 3 independent experiments. (b) Immunoblots of total protein isolated from control, IR and NAC+IR samples at 12 or 24 h post-irradiation for analysing HSPA5 expression. NAC treatment was given 1 h prior to radiation followed by IR exposure. Blots were probed with the indicated specific antibodies. Each blot is representative of 3 independent experiments. The graph shows quantification of band intensities (relative to GAPDH) from 3 independent experiments. (c) Western blot analysis of UPR marker HSPA5 in cell lysate obtained from RAW 264.7 cells irradiated in the presence of the UPR inhibitor 4-PBA (3.5 mM). The data shown are representative of at least 3 separate experiments. The graph shows quantification of band intensities (relative to GAPDH) from 3 independent experiments. (d) LC3 levels were analyzed in the samples treated with 4-PBA. The graph shows quantification of band intensities (relative to ACTB) from 3 independent experiments.
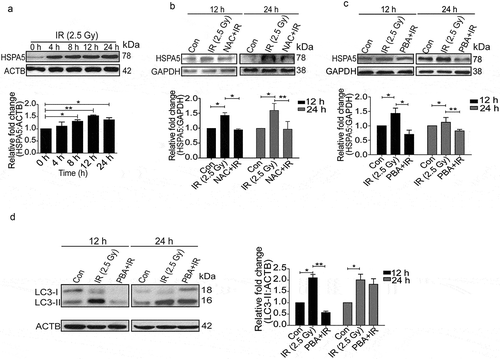
Figure 4. Radiation-induced activation profile of specific UPR pathways. (a) Immunoblot analysis of radiation-induced changes in specific UPR branch proteins at the early time point (0–1 h post-irradiation); blots were probed with HSPA5, ERN1, ATF6, p-EIF2AK3 and total EIF2AK3 specific antibodies. The time point of 0 h was taken immediately after radiation. (b) Western blot analysis of ERN1, ATF6 and p-EIF2AK3 levels at 12 and 24 h post-irradiation. (c) Immunoblot analysis of radiation-induced changes in EIF2AK3 phosphorylation and autophagy levels (LC3-II), in the presence of the EIF2AK3 inhibitor GSK2606414 at 12 and 24 h post-irradiation. The graph shows quantification of band intensities (relative to ACTB). (d) Immunoblot analysis of radiation-induced changes in the cleavage of XBP1 and autophagy levels (LC3-II), in the presence of the ERN1 inhibitor DBSA at 12 and 24 h post-irradiation. The graph shows quantification of band intensities (relative to ACTB) from 3 independent experiments.
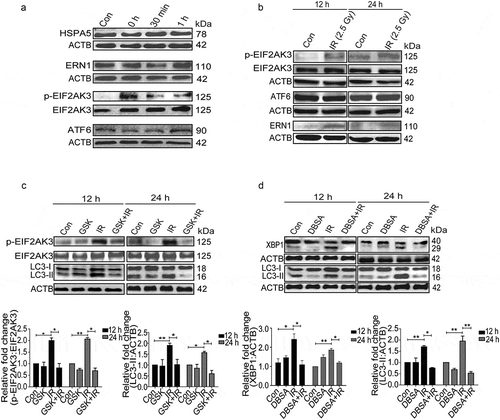
Figure 5. Radiation-induced autophagy is pro-survival and anti-apoptotic. (a) Cells were irradiated in the presence of the autophagy inhibitor, 3-MA (0.5 mM). SRB data (cell viability, shown in upper graph, *P < 0.05, ***P < 0.001, at 12 and 24 h post-irradiation respectively) and MTT data (metabolic viability, shown in lower graph, *P < 0.05, at 12 and 24 h post-irradiation respectively) at 12 and 24 h post-irradiation shows the reduced viability of RAW 264.7 cells. (b) Cells were irradiated in the presence of the autophagy inhibitor, BafA1 (2.5 nM). Shown in the upper graph is cell viability (SRB) in the presence of BafA1 (*P < 0.05, ***P < 0.001, at 12 and 24 h post-irradiation respectively) whereas in the lower graph, metabolic viability in the presence of BafA1 is shown (**P < 0.01, at 12 and 24 h post-irradiation respectively). (c) The clonogenic assay was performed to study the cell survival in the presence of 3-MA and BafA1. The bar graph shows the survival fraction of cells irradiated in the presence of 3-MA (upper panel) or BafA1 (lower panel). (**P < 0.01, *P < 0.05, for 3-MA+IR vs IR and BafA1+ IR vs IR, respectively). (d) Cell survival studies in the presence of the autophagy inducer rapamycin. The clonogenic assay was performed in the presence of 25 nM rapamycin. The bar graph shows the survival percentage of cells treated with rapamycin in the absence or presence of radiation. (e) Left panel: A bar graph showing mean fluorescence intensity of propidium iodide uptake in irradiated samples in the presence of BafA1 as compared to unirradiated control cells using flow cytometry at 12 and 24 h post-IR exposure. ***P < 0.001, *P < 0.05, at 12 and 24 h post-irradiation respectively. Right panel: Western blot analysis of cell lysate obtained at 12 and 24 h post-irradiation from BafA1+ IR treated cells. Blots were probed with intrinsic apoptosis markers, cleaved PARP1 and cleaved CASP3; GAPDH was used as a loading control. (f) Effect of Atg7 and Ulk1 siRNA on the levels of autophagy. Cells were reverse transfected with Atg7- and Ulk1-specific siRNAs (50 nM) and incubated for 24 h. Next, cells were either starved for 3 h or exposed to radiation, harvested after 24 h and immunoblotted with specific antibodies against ATG7, ULK1 and LC3. The effect of si-Atg7 on autophagic flux was further studied in the presence of BafA1. (g) Effect of genetic downregulation of autophagy on cell viability. Cells were reverse transfected with si-Atg7 and Ulk1 and incubated for 24 h. Next, cells were either starved for 3 h or kept in complete medium and exposed to 2.5 Gy radiation. After 24 h post-irradiation, SRB assay was performed to study cell viability. *P < 0.05, for IR vs si-Atg7, Strv.+IR vs si-Atg7+ IR+Strv., *P < 0.05 IR vs si-Ulk1+ IR and ***P < 0.001 Strv.+IR vs si-Ulk1+ IR+Strv. respectively. Strv., starvation.
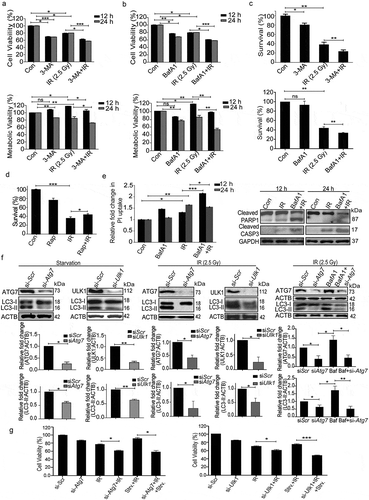
Figure 6. The pro-survival nature of radiation-induced autophagy is ROS and UPR dependent. (a) The clonogenic assay was performed after exposing cells to radiation in the presence of the ROS quencher NAC. The graph represents percent survival after irradiation compared to control. **P < 0.01, for IR and NAC-treated radiation control. (b) The clonogenic assay was performed after exposing cells to radiation in the presence of 4-PBA. The graph represents percent survival after irradiation compared to control. **P < 0.01, for IR and PBA-treated radiation control. (c) Western blot of cell lysates obtained 12 and 24 h post-irradiation from NAC alone, and NAC+IR treated cells was performed for the apoptotic marker, cleaved PARP1. Each blot is representative of 3 independent experiments. The graph shows quantitation of band intensities (relative to GAPDH) from 3 independent experiments. (d) Immunoblotting of PBA and PBA+IR treated samples at 12 and 24 h post-irradiation was performed to study apoptosis after ER stress inhibition. Each blot is representative of 3 independent experiments. The graph shows quantitation of band intensities (relative to GAPDH) from 3 independent experiments. (e) Apoptosis was analyzed using ANXA5/annexin V-PI staining followed by flow cytometry in RAW 264.7 cells treated with ROS and UPR inhibitors, NAC and PBA respectively. Numbers under each cytogram represents total apoptosis (early+late). The same has been represented by bar graph in the right panel. The experiment was performed in triplicates, and the values are represented with SD.
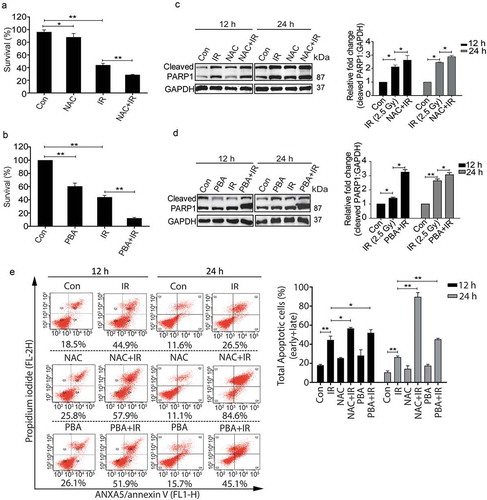
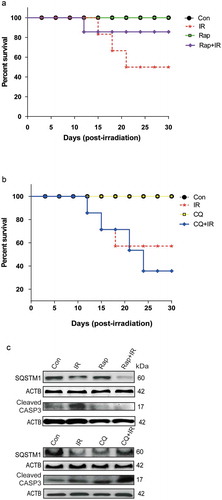
Figure 7. Radiation-induced autophagy is pro-survival under in vivo conditions. (a) The effects of autophagy inducer Rapamycin (2 mg/kg body weight) on survival during the first 30 d after 8 Gy irradiation in mice. C57BL/6 mice were randomized into 4 groups: control, IR, Rap, Rap+IR. Rapamycin was administered via an intraperitoneal (i.p.) route in a single dose, 1 h prior to irradiation. Mice were observed for their body weight (Table S1), and lethality was scored daily for the first 30 d. Kaplan-Meier analysis was performed for mice receiving 8 Gy of total body irradiation. Each treatment group contained at least 6 animals. (b) The effect of the autophagy inhibitor chloroquine (10 mg/kg body weight) on animal survival was studied for the first 30 d after 8 Gy irradiation in mice. C57BL/6 mice were randomized into 4 groups: control, IR, CQ alone and CQ+IR. CQ was administered via intraperitoneal (i.p.) injection in a single dose, 1 h prior to irradiation. Mice were observed for their body weight (Table S1), and lethality was scored daily for the first 30 d. Kaplan-Meier analysis was performed for mice receiving 8 Gy of total body irradiation. Each treatment group contained at least 6 animals. (c) Immunoblotting of isolated mice peritoneal cavity cells from rapamycin and chloroquine (CQ) treated mice was performed after day 8 of irradiation. Each mouse was given 4% thioglycolate treatment 72 h prior to peritoneal cavity cell isolation. Cells were lysed, and blots were probed with SQSTM1 (as a marker of autophagy) and cleaved CASP3 (as a marker of apoptosis). A total of 3 animals were sacrificed from each group for western blotting. Each blot is representative of 2 independent experiments.