Figures & data
Figure 1. H/R and I/R induces elevated levels of m6A RNA modification in cardiomyocytes and mice heart respectively. RNA dot blot analysis (upper panel) of m6A levels in H/R-treated H9c2 cells (a), NMVCs (b), and focal I/R-treated mice heart tissues (c). Methylene blue staining served as a loading control (middle panel). And quantification of RNA dots are shown (lower panel). (mean ± SD; n = 3; **P < 0.01 vs. untreated/sham). (d) The levels of m6A modification–associated genes in 10 pairs of heart tissues from infarct patients and normal heart tissues (mean ± SD; n = 10; ***P < 0.001 vs. normal heart). (e) The mRNA and protein levels of METTL3 and METTL14 in H/R-treated H9c2 cells, NMVCs, and focal I/R-treated mice heart tissues (mean ± SD; n = 6; **P < 0.01 and ns: no significant difference vs. untreated/sham). (f) H9c2 cells and NMVCs with or without METTL3 knockdown were exposed to H/R, or WT and mice lacking cardiac METTL3 (Mettl3-KO) (WT: Mettl3flox/flox MerCreMer+/+ treated with oil; TAM: Mettl3+/+ MerCreMer+/+ treated with tamoxifen; KO: Mettl3flox/flox MerCreMer+/+ treated with tamoxifen) were exposed to focal I/R. Total RNA was extracted, and m6A content was determined (mean ± SEM; n = 6; **P < 0.01 vs. shCtrl/Sramble/WT Mettl3 mice). All above the heart tissue samples were collected from the injured region of I/R-treated mice. P values were calculated with student’s t-test.
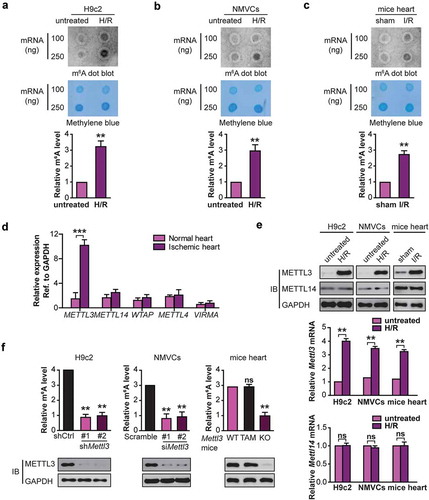
Figure 2. Upregulation of METTL3 impairs autophagic flux and enhances apoptosis in H/R-treated cardiomyocytes. (a) Representative images of western blots in H/R-treated H9c2 cells along with or without BafA incubation. The LC3B-I, LC3B-II, and SQSTM1 levels were determined by western blotting. Quantification of LC3B-II protein levels are shown (mean ± SD; n = 3; *P < 0.05 and **P < 0.01). (b) Representative images of western blots of the LC3B-I, LC3B-II, and SQSTM1 of heart tissues of injured region from Mettl3 wild-type and knockout mouse with or without focal I/R. (WT: Mettl3flox/flox MerCreMer+/+ treated with oil; TAM: Mettl3+/+ MerCreMer+/+ treated with tamoxifen; KO: Mettl3flox/flox MerCreMer+/+ treated with tamoxifen). Quantification of SQSTM1 protein levels are shown (mean ± SD; n = 6; ***P < 0.001 and ns: no significant difference). (c) NMVCs were transfected with adenovirus harboring tandem fluorescent mRFP-GFP-LC3 (Ad-LC3-NMVCs) for 24 h and then subjected to different treatments. Representative pictures of immunofluorescent NMVCs expressing mRFP-GFP-LC3 are shown. GFP dots are green, and mRFP dots are red. Semi-quantitative analysis of autophagosomes (AP/autophagosome: yellow dots in merged images) and autolysosomes (AL/autolysosome: red-only dots in merged images). (mean ± SD; n ≥ 35; *P < 0.05 and ns: no significant difference). (d) NMVCs were infected with an adenovirus siRNA for Mettl3 (Ad-siMettl3) and then cultured under H/R conditions or normoxia. Apoptosis analysis was performed, and representative flow cytometry images are shown. The percentage of apoptosis was increased significantly after H/R whereas knockdown of METTL3 attenuated the effects of H/R on NMVCs. Quantifications of apoptotic cell percentage were shown (mean ± SD; n = 3; *P < 0.05 and **P < 0.01). P values were calculated with student’s t-test.
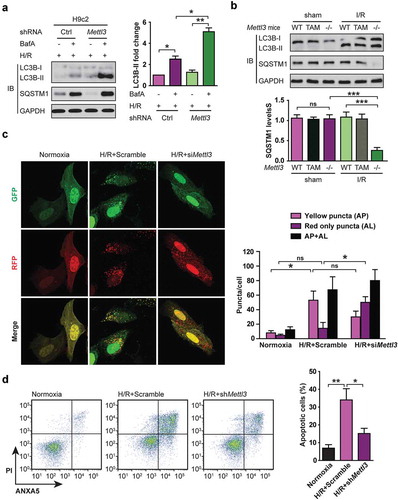
Figure 3. TFEB is required for shMettl3-enhanced autophagy flux in H/R-treated cardiomyocytes. (a) H9c2 cells were transfected with the indicated treatment before cells were lysed and subjected to immunoblot analysis. (b) Immunoblot analysis of cleaved CASP3 expression in H9c2 cells with the indicated treatment. (c) NMVCs were transfected with indicated treatment before cells were lysed and subjected to immunoblot analysis. (d) Immunoblot analysis of cleaved CASP3 expression in NMVCs with the indicated treatment. (e) The Mettl3+/+ and mettl3−/- mice were subjected to focal I/R. Myocardial TFEB proteins and activities in these mice model were compared. Nuclear TFEB was isolated and indicated TFEB activity. Quantitative protein levels are shown on the right (mean ± SD; n = 6; **P < 0.01 and ***P < 0.001). (f) H9c2 cells with or without Mettl3 knockdown were transfected with or without siRNAs targeting Tfeb as indicated. After 72 h, these cells were fixed and then stained with LysoTracker Red and DAPI. Total lysosomal area per image was counted using an ImageJ script (mean ± SD; n = 3; **P < 0.01 and ***P < 0.001). P values were calculated with student’s t-test.
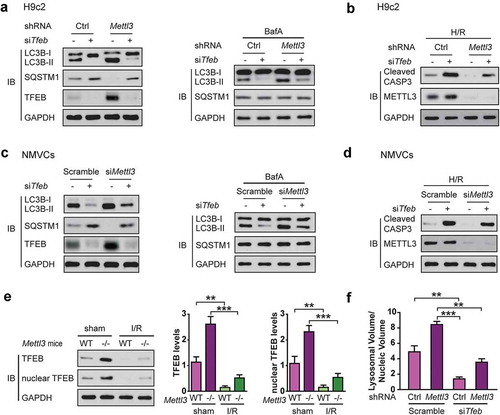
Figure 4. METTL3 knockdown stimulates TFEB expression and activity in H9c2 cells. (a) Western analysis of TFEB levels after knockdown of METTL3 in H9c2 cells. (b) H9c2 cells were transfected with a different dose of METTL3 expression vector and then subjected to immunoblot and qRT-PCR analysis. Quantification of relative Tfeb mRNA level from three independent experiments are shown on the right. (mean ± SD; n = 3; *P < 0.05, **P < 0.01 and ***P < 0.001, ns: no significant difference). (c) H9c2 cells were transfected with GFP-tagged TFEB, and shMettl3 or shcontrol and then the lysates were analyzed using an antibody to GFP. Quantification of GFP-TFEB levels after knockdown of METTL3 in H9c2 cells shown in bar graph (mean ± SD; n = 3; **P < 0.01 vs. shCtrl). (d) Representative image of the nuclear enrichment of GFP-TFEB after knockdown of METTL3 in H9c2 cells. And quantification of GFP-TFEB localization is shown in the bar graph (mean ± SD; n = 3; **P < 0.01 vs. shCtrl). (e) Immunoblot analysis indicates that silencing Mettl3 increases the nuclear levels of GFP-TFEB. (f) H9c2 cells were treated as indicated and subjected to qRT-PCR analysis to quantify the mRNAs levels of 6 established transcriptional targets of TFEB (mean ± SD; n = 3; *P < 0.05, **P < 0.01 and ***P < 0.001 vs. shCtrl). P values were calculated with student’s t-test.
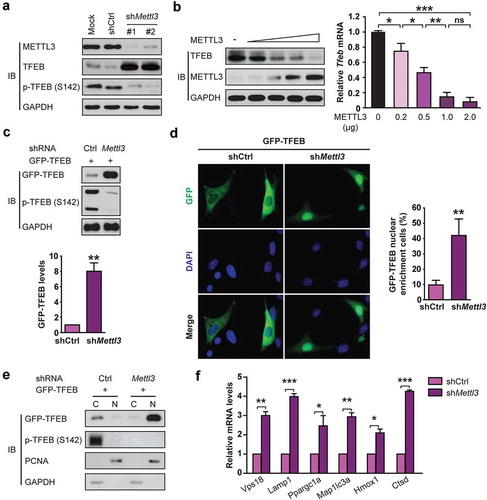
Figure 5. METTL3 decreases Tfeb mRNA stability by catalyzing its m6A methylation in H/R-treated cardiomyocytes. (a and b) H9c2 cells (a) and NMVCs (b) with or without METTL3 knockdown were exposed to H/R. m6A immunoprecipitation and qRT-PCR were performed to determine the change of Tfeb mRNA with m6A methylation. (c) Sequence analysis of TFEB 3′-UTR revealed two matches to the 5′-RRACU-3′ (methylated adenosine residue is underscored) m6A consensus sequence. (d and e) Luciferase assays were performed by transfecting H9c2 cells (d) and NMVCs (e) with a reporter plasmid containing luciferase coding sequences followed by the Tfeb-3′-UTR or empty vector only containing luciferase. The ratio indicating the luciferase activity in cells transfected with Tfeb 3′-UTR relative to empty vector was determined (relative luciferase activity: RLU). (f and g) Luciferase assays were performed in H9c2 cells (e) or NMVCs (f) transfected with WT or mutant (MUT) luciferase-Tfeb 3′-UTR reporter. The ratio of luciferase activity in cells transfected with Tfeb-3′-UTR relative to empty vector was determined. (mean ± SD; n = 3; *P < 0.05, **P < 0.01 and ***P < 0.001). P values were calculated with student’s t-test.
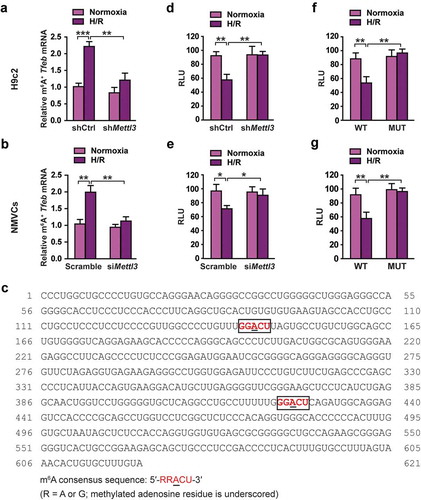
Figure 6. METTL3 promotes HNRNPD association with TFEB pre-mRNA in H/R-treated cardiomyocytes. (a and b) RIP analysis of the interaction of HNRNPD (A) or ELVAL1 (b) with Tfeb pre-mRNA using total cell lysates of H9c2 cells with or without METTL3 knockdown under normoxia or H/R condition. Enrichment of Tfeb pre-mRNA with an antibody against HNRNPD or ELVAL1 was measured by qRT-PCR and normalized to input. Western blotting was performed as indicated (mean ± SD; n = 3; **P < 0.01, ***P < 0.001 and ns: no significant difference). (c) Western blotting of TFEB expression in H9c2 cells and NMVCs with or without HNRNPD knockdown. (d) qRT-PCR analysis of Tfeb in H9c2 cells and NMVCs with or without HNRNPD knockdown (mean ± SD; n = 3; **P < 0.01 vs. Sramble in each cell line). (e) Relative activity of Tfeb 3ʹ-UTR firefly luciferase reporter in H9c2 cells and NMVCs with or without HNRNPD knockdown (relative luciferase activity: RLU). Mean ± SD; n = 3; *P < 0.05 and **P < 0.01 vs. Scramble in each cell line. P values were calculated with student’s t-test.
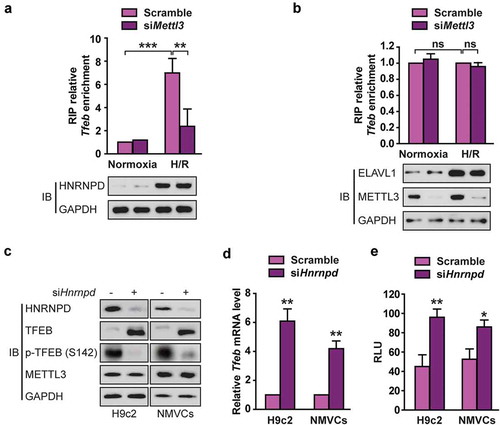
Figure 7. ALKBH5, but not FTO, reverses H/R-mediated m6A modification of TFEB mRNA in cardiomyocytes. (a) qRT-PCR analysis of Tfeb mRNA expression in H9c2 cells and NMVCs with or without ALKBH5 knockdown. Samples were normalized to Gapdh mRNA (mean ± SD; n = 3; **P < 0.01 and ***P < 0.001 vs. shCtrl). (b) Western blotting of TFEB in H9c2 cells and NMVCs with or without ALKBH5 knockdown (mean ± SD; n = 3; **P < 0.01 vs. Scramble). (c) qRT-PCR analysis of Tfeb mRNA expression and western blotting of TFEB in H9c2 cells treated with control or FTO shRNAs (mean ± SD; n = 3; ***P < 0.001 and ns: no significant difference vs. shCtrl). (d) qRT-PCR analysis of Tfeb pre-mRNA in H9c2 cells and NMVCs with or without ALKBH5 knockdown (mean ± SD; n = 3; *P < 0.05, **P < 0.01 ***P < 0.001 vs. shCtrl or Scramble). (e) RIP analysis of transcripts from the nuclear extracts of H9c2 cells expressing exogenous ALKBH5 with or without Flag tag. Enrichment of Tfeb mature and pre-mRNA with Flag was measured by qPCR and normalized to input. Western blotting of ALKBH5 showing equal expression of tagged or untagged proteins. (mean ± SD; n = 3; *P < 0.05). (f) Me-RIP-qPCR assay of m6A levels of Tfeb pre-mRNA in H9c2 cells with or without ALKBH5 knockdown and transfected with control, wild-type, or mutant ALKBH5 plasmid and treated with H/R (mean ± SD; n = 3; *P < 0.05 and **P < 0.01). (g) Western blotting of TFEB in H9c2 cells with or without ALKBH5 knockdown and transfected with control, wild type, or mutant ALKBH5 plasmid. (h) NMVCs were transfected with adenovirus harboring tandem fluorescent mRFP-GFP-LC3 for 24 h and then subjected to different treatments. And semi-quantitative analysis of autophagosomes/AP and autolysosomes/AL. (mean ± SD; n ≥ 35; *P < 0.05, **P < 0.01 and ns: no significant difference). (i) NMVCs were infected with an adenovirus ALKBH5 (Ad-ALKBH5) and then cultured under H/R conditions or normoxia. Apoptosis analysis was performed. The percentage of apoptosis was increased significantly after H/R whereas WT ALKBH5 but not its mutant significantly attenuated the effects of H/R on NMVCs. Quantifications of apoptotic cell percentage are shown (mean ± SD; n = 3; *P < 0.05 and **P < 0.01). P values were calculated with student’s t-test.
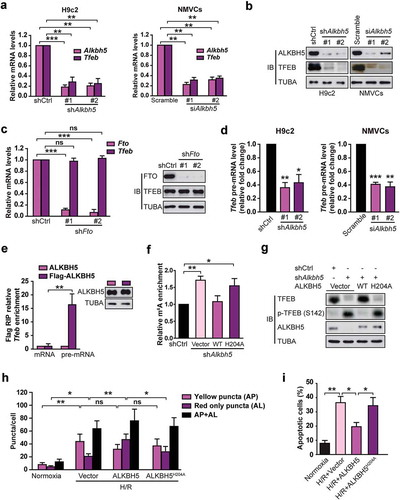
Figure 8. TFEB is identified as a novel activator of the human ALKBH5 promoter in cardiomyocytes. (a) Luciferase assays performed on cell extracts of HEK293T cells transfected with ALKBH5-Luc (−2230 bp) with increasing amounts of Flag-TFEB or empty vector. Luciferase activity was normalized to CMV-LacZ expression. GAPDH (glyceraldehyde 3-phosphate dehydrogenase) level acted as a loading control (RLU: relative luciferase activity) (mean ± SD; n = 3; *P < 0.05, **P < 0.01 and ***P < 0.001 vs. Vector). (b) H9c2 cells were transfected with indicated plasmids for 24 h. Immunoblotting with indicated antibodies and qRT-PCR were performed (mean ± SD; n = 3; *P < 0.05, **P < 0.01 and ns: no significant difference vs. Vector). (c) H9c2 cells were transfected with or without shRNA targeting TFEB (shTfeb, 100 nmol/L each) for 24 h. Immunoblotting with the indicated antibodies and qRT-PCR were performed (mean ± SD; n = 3; **P < 0.01, ***P < 0.001 and ns: no significant difference vs. shCtrl). (d) Schematic diagram of the human ALKBH5 promoter. Positions of conserved E-box motifs (CANNTG) in the ALKBH5 promoter relative to the transcription start are indicated. (e) HEK293T cells were transfected with a TFEB expression plasmid and the indicated ALKBH5 promoter constructs harboring E-box mutations. Luciferase assays were performed, and data are represented as mean ± SD (mean ± SD; n = 3; *P < 0.05, **P < 0.01 and ***P < 0.001 and ns: no significant difference). (f) ChIP assay was performed on chromatin from serum starvation-treated H9c2 cells using antibodies against TFEB. Primers flanking E-boxes 1, 2, 3, and 4 of the Alkbh5 promoter were used. (g) ChIP assay was performed on chromatin from H/R-treated and untreated NMVCs. Chromatin was immunoprecipitated with antibodies against TFEB. Antibodies against IgG were used as a control. (h) ChIP assay was performed on chromatin from doxorubicin- and DMSO-treated NMVCs. P values were calculated with student’s t-test.
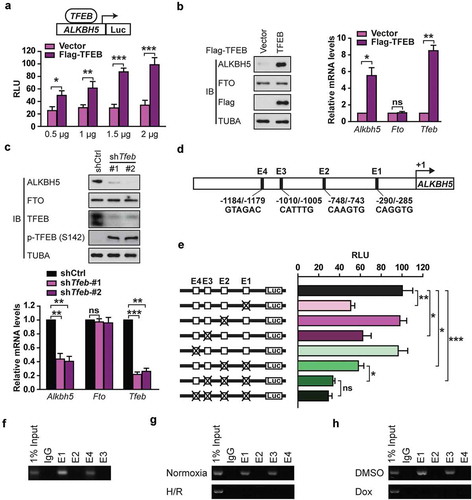
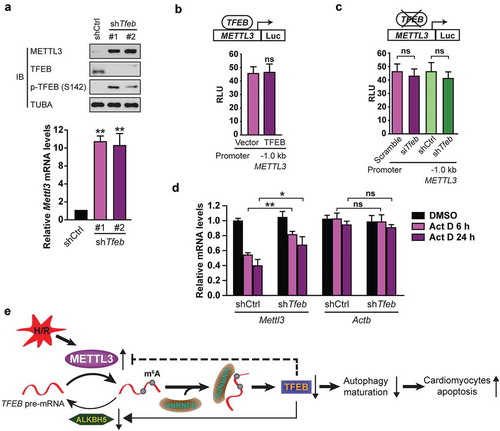
Figure 9. TFEB inhibits METTL3 at the posttranscriptional level in cardiomyocytes. (a) H9c2 cells were transfected with or without shRNA targeting TFEB (shTfeb, 100 nmol/L each) for 24 h. Immunoblotting with the indicated antibodies and qRT-PCR were performed (mean ± SD; n = 3; **P < 0.01 vs. shCtrl). (b) TFEB overexpression does not affect the transcription of the human METTL3 promoter. H9c2 cells were transfected with 0.5 μg of the METTL3 promoter (−1.0 kb) along with 1 μg of indicated vectors. (mean ± SD; n = 3; ns: no significant difference vs. Vector). (c) Transient and stable knockdown of TFEB does not alter METTL3 transcription by using −1.0 kb METTL3 promoter luciferase reporters (mean ± SD; n = 3; ns: no significant difference vs. Scramble or shCtrl). (d) TFEB expression decreases Mettl3 mRNA stability. H9c2 cells transfected for 48 h with or without a shRNA against TFEB were incubated for the indicated periods with 10 μg of Act D before relative mRNA levels of Mettl3 and Actb were assessed by qRT-PCR (mean ± SD; n = 3; *P < 0.05, **P < 0.01 and ns: no significant difference vs. shCtrl Act D 6 h/24 h). (e) A proposed model for the critical link between METTL3, ALKBH5 and autophagy in H/R-treated cardiomyocytes. P values were calculated with student’s t-test.