Figures & data
Figure 1. epg5 expression patterns during zebrafish development. (a) RT-qPCR analysis of epg5 expression. The graph shows the relative epg5 transcript abundance in whole zebrafish embryos and larvae, from 0 hpf to 6 dpf. Error bars indicate ± SEM. Data were generated from 3 biological replicates, each a pool of 15 embryos or larvae. (b) Spatio-temporal expression of epg5 transcripts during zebrafish development, as revealed by WMISH performed at the indicated stages. All embryos or larvae are lateral views with the animal pole up (1-cell and 8-hpf) and head pointing to the left (24-hpf, 3-dpf and 6-dpf). Scale bar: 200 μm. (c) Graph showing the relative abundance of epg5 transcripts in zebrafish adult tissues, as determined by RT-qPCR. Error bars indicate ± SEM. Data were generated from 4 adult zebrafish (2 males and 2 females).
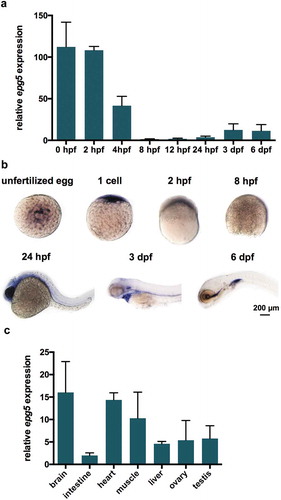
Figure 2. Knockout of zebrafish epg5 gene. (a) Nucleotide and amino acid sequences showing the 13-bp and 20-bp deletion mutations, as revealed by DNA sequencing analysis of the epg5 CRISPR target site. Each deleted nucleotide is represented by a dash. CRISPR target site, highlighted in grey with the protospacer-adjacent motif sequence in bold, was designed within the second coding exon, corresponding to exon 3 of the epg5 gene. The epg5 sequence is shown from the start codon to the newly formed stop codons resulting from the introduced frameshifts in the coding region. The new amino acid residues resulting from nucleotide loss after CRISPR-Cas9 editing are labelled in bold red. (b) RT-qPCR analysis of 5-dpf WT and epg5-/- larvae, showing a statistically significant decrease of epg5 expression in epg5-/- mutants. Values represent the mean ± SEM. Data were generated from 3 biological replicates, each a pool of 15 larvae. Statistical significance was determined by two tail Student’s t-test (*, P < 0.05). (c) WMISH analysis of epg5 expression in 24-hpf WT and epg5-/- mutant embryos. Embryos are lateral views with head pointing to the left. Scale bar: 200 μm.
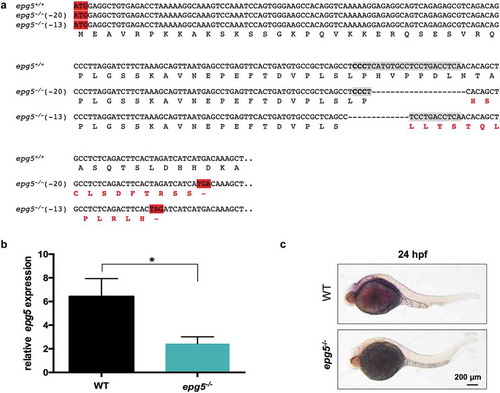
Figure 3. Autophagy impairment in zebrafish epg5-/- mutants. (a) Representative western blot for Lc3 in WT and epg5-/- larvae at 8 dpf and 11 dpf, and (b) densitometric analysis of band intensities. Actb/β-actin was used as a control for protein loading. Statistical significance was determined by one tail Student’s t-test. Data are presented as mean ± SEM and were generated from 4 biological replicates with pools of 10 larvae (*, P < 0.05; n.s., not significant). (c) Transmission electron microscopy analysis of skeletal muscle of WT and epg5-/- larvae and adults. WT larvae and adults (upper panels) display well-organized myofibrils with subsarcolemmal mitochondria (M) and a well-developed sarcoplasmic reticulum (SR). 8-dpf epg5-/- larvae do not display overt changes of the ultrastructural organization of muscle fibers with respect to WT larvae, except for some subsarcolemmal membrane-like structures (ml), and some mitochondria with dilation of the outer membrane (arrows). Changes suggestive of altered autophagic flux, as accumulation of autophagosomes (AF), are evident in 11-dpf epg5-/- larvae. Although at a lesser extent, autophagosomes are also present in adult epg5-/- zebrafish. Ultrastructural analysis was performed on 4–5 animals for each condition. Scale bar: 1 µm.
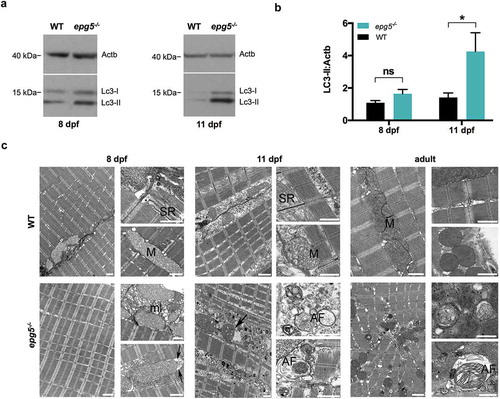
Figure 4. Starvation response of zebrafish epg5 mutants. (a) Representative western blot for Lc3 in 8-dpf WT and epg5-/- larvae under fed and fasting conditions (left panel), and densitometric analysis of band intensities (right panel). β-actin was used as a control for protein loading. Lc3-II expression was higher in homozygous mutants with respect to WT and, upon starvation, epg5-/- mutant larvae exhibited a significantly higher increase of Lc3-II levels than the corresponding WT larvae. Statistical significance was determined by one tail t-test. Data are presented as mean ± SEM and were generated from 3 biological replicates with pools of 12 larvae (*P, < 0.05; **, P < 0.01; ***, P < 0.001). (b). Light microscopy analysis of muscle birefringence in 8-dpf WT and epg5-/- larvae under fed conditions and following two-day starvation (left panels), and quantification of muscle birefringence (right panel). Bright field images of WT and epg5-/- larvae are shown for reference. A global decrease of muscle birefringence is detected in fasted WT and epg5-/- larvae, but two-day starvation led to a significantly higher decrease of muscle birefringence in epg5-/- larvae when compared to controls, consistently with a myopathic phenotype. Quantification of birefringence was calculated as described in the Methods section. Statistical significance was determined by Student’s t-test. Data are presented as mean ± SEM and were generated from 3 different experiments, each containing 10 larvae per genotype and treatment condition (*, P < 0.05; **, P < 0.01; ****, P < 0.0001). Scale bar: 1 mm. (c) Transmission electron microscopy analysis of 8-dpf WT and epg5-/- larvae (left panels) and adults (right panels) subjected to food starvation for 2 d. In agreement with a defective regulation of autophagy, starved epg5-/- mutant larvae and adults display an accumulation of autophagosomes (AF) and membrane-like structures (ml). In contrast, starved WT larvae and adults display enlarged mitochondria (M) and rare autophagosomes (AF). Ultrastructural analysis was performed with 4–5 animals per genotype. Scale bar: 1 µm.
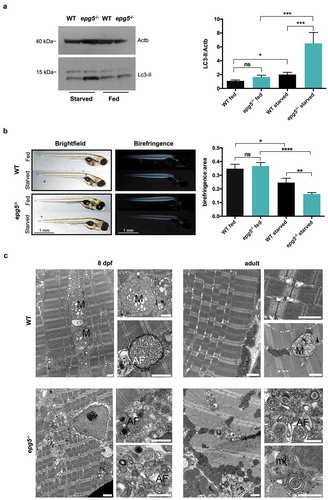
Figure 5. epg5-/- larvae display decreased number of goblet cells and higher incidence of cell death in the intestine. (a) Detection of mucin-containing goblet cells in 6-dpf WT and epg5-/- mutant larvae by whole mount alcian blue staining. The graph reports quantification of average mucin area:goblet cells (WT, n = 16; epg5-/-, n = 11). Statistical significance was determined by Student’s t-test, and data are presented as mean ± SEM (**, P < 0.01). The left panels show representative images of alcian blue stained WT and epg5-/- larvae. Scale bar: 200 μm. (b) Quantification of the number of total, mature and immature goblet cells at 6 dpf (WT, n = 7; epg5-/-, n = 11). Statistical significance was determined by Student’s t-test, and data are presented as mean ± SEM (**, P < 0.01; ***, P < 0.001; ns, not significant). (c) Analysis of intestinal Sox9b-positive cell by means of immunofluorescence in 4- and 5-dpf larvae (WT, n = 10; epg5-/-, n = 10). Statistical significance was determined by Student’s t-test, and data are presented as mean ± SEM (**, P < 0.01). The left panels show 4 representative images of WT and epg5-/- larvae. Scale bar: 100 μm. (d) Analysis of intestinal cell death by means of acridine orange staining in 6-dpf larvae (WT, n = 10; epg5-/-, n = 10). Statistical significance was determined by Student’s t-test, and data are presented as mean ± SEM (**, P < 0.01). The left panels show 2 representative images of acridine orange stained WT and epg5-/- larvae. Scale bar: 200 μm.
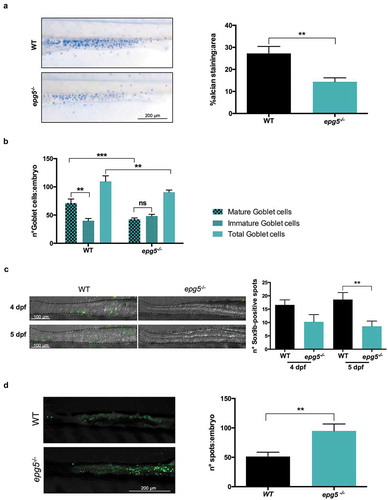
Figure 6. Ultrastructural changes in the intestine of epg5-/- mutants. Transmission electron microscopy of 8-dpf WT (a–c) and epg5-/- (d–f) larvae, showing swelling of mitochondria (arrows in D and E) and increased density of mucous granules within goblet cells (asterisks in D and F) in epg5-/- larvae. G, goblet cell; L, lumen; M, mitochondrion; m, microvilli; mg, mucous granules; N, nucleus. Scale bar: 400 nm.
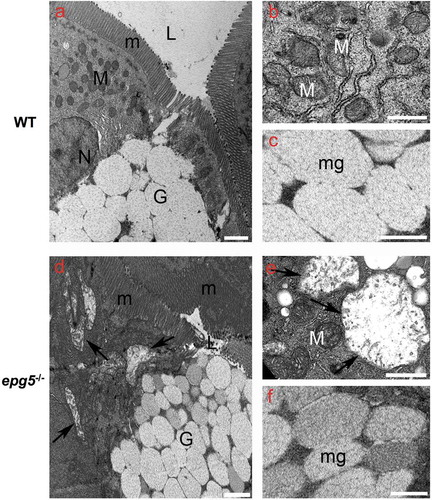
Figure 7. epg5-/- larvae display slower growth rates. (a) Growth curve of WT and epg5-/- larvae derived from homozygous parents. Body length (in mm) was measured from 6 dpf to 44 dpf. The body length of epg5-/- larvae was significantly lower than WT from 6 to 19 dpf. Statistical significance was determined by multiple t-test comparing each age group using the Holm-Sidak method, and each age group was analyzed individually without assuming a consistent SD. Data are presented as mean ± SD (*, P < 0.05; n = 16 for each age and genotype). (b) Body length of siblings at 15 dpf from an outcross between one heterozygous female and one homozygous male. Statistical significance was determined by Student’s t-test. Data presented as mean ± SEM (**, P < 0.01; epg5-/-, n = 8; epg5±, n = 7).
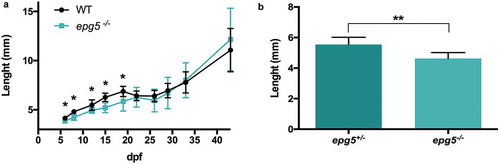
Figure 8. Epg5 deficiency causes multiple tissue defects in adult zebrafish. (a) Effects of Epg5 deficiency on heart morphology in a zebrafish mutant male (9 mpf) in comparison with a WT fish at the same age. The boxed areas are shown at higher magnifications, to compare the compact myocardium structure between the 2 genotypes. epg5-/- heart displays a thinner compact myocardium, with an altered trabecular network containing clumps of red cells. A, atrium; Ba, bulbus arteriosus; C, clump, Cm, compact myocardium; Sv, sinus venosus; T, trabeculae; V, ventricle. (b) Effects of Epg5 deficiency on ovarian morphology in an epg5-/- mutant female (10 mpf), in comparison with a WT fish at the same age. epg5-/- ovary contains only immature stage I oocytes of the perinucleolar stage (Po), whereas WT ovary contains oocytes at different developmental stages. The arrows point at areas of interstitial edema. Ca, cortical alveolus stage oocyte; Mo, mature oocytes; Vo, vitellogenic stage oocyte. (c) Effects of Epg5 deficiency on testicular morphology in a male epg5-/- mutant (4 mpf) in comparison with a WT fish at the same age. Spermatozoa (Sz) and all stages of spermatogenesis are present on WT testis, whereas the tissue structure is disorganized in the epg5-/- testis, which also contains empty tubules (asterisk). Sc, spermatocytes; Sg, spermatogonia.
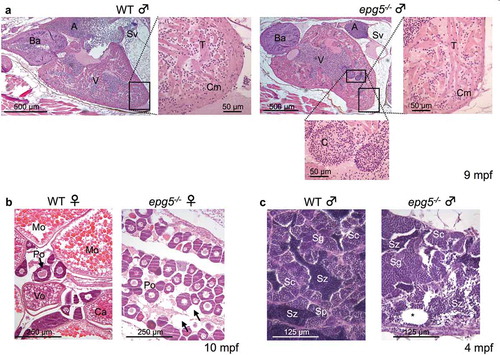
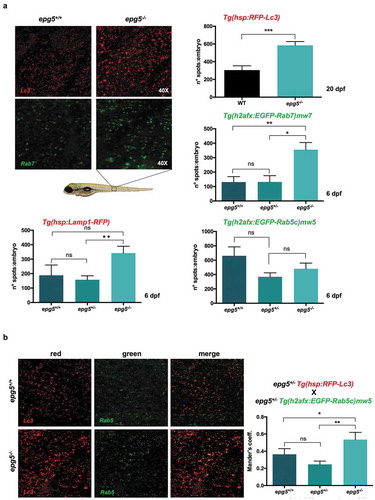
Figure 9. epg5-/- mutants display reduced autophagosome-lysosome fusion. (a) Representative fluorescence microscopy images and quantification of fluorescence spots for Lc3, Rab7, Rab5 and Lamp1 in sibling larvae obtained by crossings of epg5± mutants with the respective transgenic reporter fish lines (see also Methods). Analysis of fluorescence spots was performed in larvae at 20 dpf for Lc3 (n = 18), and in larvae at 6 dpf for the other markers. Statistical significance was determined by Student’s t-test, and data are represented as mean ± SEM (*, P < 0.05; **, P < 0.01; ***, P < 0.001; ns, not significant; n = 30 for each transgenic line). (b) Quantification of the colocalization between Rab5 spots (green) and Lc3 spots (red) in 6-dpf siblings obtained by crossings of epg5+/- mutants with the Rab5 and Lc3-double transgenic background, using Mander’s coefficient. Statistical significance was determined by Student’s t-test, and data are represented as mean ± SEM (*, P < 0.05; **, P < 0.01, ns, not significant; n = 22 for each genotype).