Figures & data
Figure 1. Respiratory chain deficiency causes lysosomal enlargement independently of autophagy. (a) Increase in the number of GFP-LC3-positive structures in the RC-kd cells. Representative equatorial (through the middle of the cell) plane confocal images show autophagosome distribution (by expression of the autophagosomal marker GFP-LC3) in HeLa cells with scrambled control (upper panel), or stable knock-down of the respiratory chain subunit UQCRC1 (RC-kd1 and RC-kd2, lower panel). Scale bar: 2 μm. The quantification of average lysosomal area is presented in the plot in the upper right panel as average ± s.e.m.(s.e.m), (scrambled N = 54 cells; RC-kd1 N = 60 cells; RC-kd2 N = 54 cells; from three independent experiments). ANOVA adjusted p-value *p < 0.05 **p < 0.001. (b) Western blot analysis of whole-cell extracts for LC3B in RC-kd and scrambled control HeLa cells, using GAPDH as loading control. The band for LC3B-II, a marker of autophagosomal mass, is increased in RC-kds. Column plot shows average plus standard deviation of at least three independent experiments, with duplicates in each experiment. ANOVA p-value *p < 0.05. (c) Autophagosomes remain undigested in the RC-kd cells. Representative spinning disk confocal images of autophagosome and lysosomes, by co-expression of the lysosomal marker LAMP1-GFP and of the autophagosomal marker RFP-LC3 in scrambled control or RC-kd HeLa cells, or HeLa cells treated with chloroquine, as a positive control for impaired lysosomal function. Scale bar: 0.5 μm. The insets on the right side show the magnification of the areas inside the squares. (d) Lysosomal volume is increased in the RC-kd cells. Representative confocal microscopy images of HeLa cells (scrambled, upper panel; or RC-kds, bottom panel) stained with anti-LAMP1 antibody (secondary conjugated with Alexa-488 fluorophore). Scale bar: 2 μm. The box plot on the upper right panel shows the distribution of the lysosomal volume across at least 50 cells obtained for each condition, obtained from three independent experiments, and also indicates the average volume and the standard deviation. T-test p-value **p < 0.005. The histogram on the lower right panel indicates the frequency distribution of lysosomal size in the control and RC-kd cells, showing that the RC-kds have less small lysosomes (<5 nm3) and a robust increase in the amount of very large lysosomes (>15 nm3). (e) Saturated lysosomes are detected in RC-kds. Representative electron micrographs showing the presence of electron-dense (saturated) lysosomes in RC-kd cells, which are rarely observed in control cells. Scale bar: 500 nm. The box plot on the upper right panel shows the distribution of the lysosomal volume across at least 12 cells obtained for each condition, obtained from 3 independent experiments, and also indicates the average volume and the standard deviation. T-test p-value *p < 0.05. The histogram on the lower right panel indicates the frequency distribution of lysosomal size in the control and RC-kd cells, showing that the RC-kds have less small lysosomes and an increase in the amount of very large lysosomes. (f) Lysosomal enlargement in RC-kds is not caused by excessive autophagosome trafficking. Representative confocal microscopy images of HeLa cells (scrambled, upper panel; or RC-kds, bottom panel), transfected with siRNA against ATG5 or a scrambled sequence (siRNA control), stained with anti-LAMP1 antibody (secondary conjugated with Alexa Fluor 488 fluorophore). Scale bar: 2 μm. The plot on the right panel shows the average ± s.e.m. lysosomal volume across at least 40 cells obtained for each condition, obtained from 2 independent experiments. ANOVA p-value **p < 0.01. The histogram on the bottom panel indicates the frequency distribution of lysosomal size in the control and RC-kd cells, showing that the silencing of ATG5 caused an increase in the number of larger lysosomes both in scrambled and RC-kd HeLa cells.
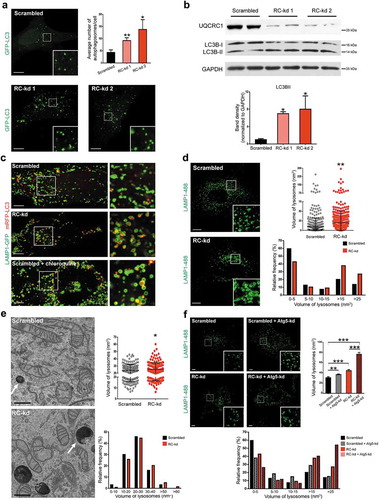
Figure 2. Respiratory chain deficiency causes impaired lysosomal function and accumulation of lysosomal Ca2+. (a) Lysosomal acidification is impaired in RC-kd. Representative equatorial plane confocal images of RC-kd and scrambled control HeLa cells stained with dextran-Oregon Green and dextran-TMRM. Scale bar: 2 μm. Dextran-Oregon Green is quenched under acidic pH, so increased green:red ratio denotes impaired lysosomal acidification. The average ± s.e.m. green:red ratio for at least 40 cells in 3 independent experiments is presented in the plot on the right panel (normalized to scrambled green/red = 1). (b) Decreased lysosomal proteolytic capacity in RC-kd. DQ-BSA is bovine serum albumin labelled with a green fluorophore. It is taken up by endocytosis, and delivered to the lysosomes. As a monomer, the fluorophore is too concentrated and the signal is quenched. As DQ-BSA is degraded by the lysosomal proteases, it releases monomers which emit fluorescence. This process is illustrated in the figure. The rate of DQ-BSA hydrolysis (increase of fluorescence units per min, per mg of protein) is a function of lysosomal proteases, and was measured using a plate reader over 2 h. The linear range was used to determine the rate. The average ± s.e.m. rate for each condition (20 wells in a 96-well plate) is presented in the plot on the upper right panel. These values are a representative experiment. Three independent experiments were performed, with at least 20 wells per condition. ANOVA p-value *p < 0.05 ***p < 0.001. (c) Increased lysosomal Ca2+ levels in RC-kds. Cells are loaded with the lysosomotropic compound Gly-Phe β-naphthylamide (GPN), which readily diffuses throughout the cell. When entering the lysosome, GPN is activated by CTSC, and the activated product forms pores in the lysosomal membrane which allow the release of lysosomal contents to the cytoplasm, including Ca2+. The increase in cytoplasmic Ca2+ upon GPN treatment is measured by changes in the fluorescence intensity of the cytoplasmic Ca2+ indicator Fluo-4 over time. The process is illustrated in the upper panel. The curves obtained for Fluo-4 fluorescence intensity over time scrambled and RC-kds cells are presented in the bottom panel (average of at least 32 cells per condition, in 3 independent experiments), normalized to the fluorescence intensity in the first frame. The increased magnitude of the peaks are a function of increased lysosomal Ca2+contents in RC-kds. The Fluo-4 intensity curves in the presence of ITPR/IP3R inhibitor xestospongin C are presented as dotted lines (here, average of 30 cells from 2 independent experiments is shown). (d) Quantification of the peak height in the GPN-induced release of lysosomal Ca2+ to cytoplasm, as an estimation of lysosomal Ca2+ contents. In the plot, the scrambled and RC-kds (RC-kd1 and RC-kd2) are shown (average ± s.e.m. of at least 29 cells per condition in 3 independent experiments) both under basal conditions and after treatment with MLSA1 20 µM for 4 h, prior to the GPN experiment. MLSA1 is an activator of MCOLN1, one lysosomal Ca2+ channel. The RC-kds have increased lysosomal Ca2+, which is normalized when the cells are treated with the activator of MCOLN1. ANOVA p-value *p < 0.05 ***p < 0.001; n.s. (e) Protein levels of MCOLN1 are not changed in RC-kd. Representative western blot of whole-cell extracts for MCOLN1 in RC-kd and scrambled control HeLa cells, in duplicate, using GAPDH as loading control. Column plot shows average plus standard deviation of at least 2 independent experiments, with duplicates in each experiment. T-test yielded a p-value>0.05 (non-significant, n.s.). (f) Lysosomal enlargement in RC-kd is rescued by reactivation of MCOLN1. Representative equatorial plane confocal images of HeLa cells (scrambled, upper panel; or RC-kds, bottom panel), treated with the MCOLN1 activator MLSA1 20 µM 4 h (or DMSO as vehicle control), stained with anti-LAMP1 antibody (secondary conjugated with Alexa Fluor 488 fluorophore). Scale bar: 2 μm. The plot on the right panel shows the average ± s.e.m. lysosomal volume across at least 45 cells obtained for each condition, obtained from 3 independent experiments. ANOVA p-value *p < 0.05,**p < 0.005. (g) Cytoplasmic Ca2+ levels are decreased in RC-kd, and return to control values upon MCOLN1 reactivation. Cytoplasmic Ca2+ levels were assessed using the cytoplasmic indicator Fluo-4, by flow cytometry in scrambled, RC-kd cells treated with MCOLN1 activator MLSA1 20 µM 4 h (or DMSO as vehicle control). The average distribution of cells per fluorescence intensity is plotted on the left panel. The quantification of the average ± st.dev of at least 3 independent replicates (repeated twice, representative experiment plotted) per condition is presented in the bar graph. ANOVA p-value *p < 0.05, ***p < 0.001.
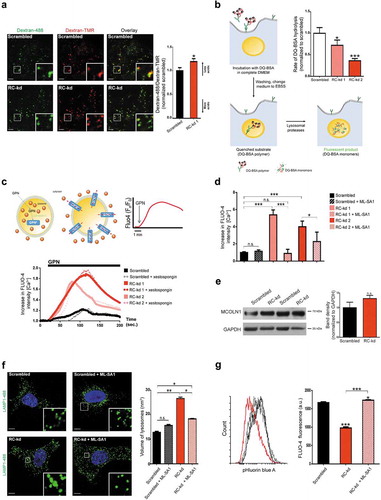
Figure 3. AMPK signaling is downregulated in RC-kd. (a) Schematic representation of the pathway presumably linking AMPK with MCOLN1 activity. (b) Western blot analysis of whole-cell extracts (first 2 lanes) as well as extracts obtained from AMPK immunoprecipitation, using a pan-antibody against PRKAA1 and PRKAA2. Lanes 3–4 show two independent experiments of AMPK immunoprecipitate in control cells, and lanes 5–6 show 2 independent experiments of AMPK immunoprecipitate in RC-kd cells. Lanes 7–8 show the unbound eluate, and lane 9 is the negative control. The proteins detected include AMPK and PIKFYVE, which is readily detected in the AMPK immunoprecipitate. GAPDH is detected in the input samples and in the unbound eluate, but not in the AMPK immunoprecipitate, demonstrating specificity of the interaction between AMPK-PIKFYVE. (c) Decreased phosphorylation of AMPK targets in RC-kd. Western blot analysis of whole-cell extracts for UQCRC1, AMPK, p-AMPK (T172), TSC2. p-TSC2 (S1387) and PIKFYVE in RC-kd and scrambled control HeLa cells, using GAPDH as loading control. The bands for UQCRC1, p-AMPK and p-TSC2 are decreased in RC-kds, while there is no change in PIKFYVE protein amount, as shown in the plots on the right side. Column plot shows average±s.d. of 3 independent experiments, with duplicates in each experiment. T-test p-value *p < 0.05 (d) Decreased PtdIns(3,5)P2 levels in the lysosomes of RC-kd cells, returned to control levels by reactivation of AMPK. Representative equatorial plane confocal images of HeLa cells (scrambled with vehicle control DMSO; scrambled with PIKFYVE inhibitor YM201636 1 μM 4 h; RC-kds with vehicle control DMSO; RC-kd treated with AMPK activator A769662 100 μM 4 h), cotransfected with ML1N*2-GFP and LAMP1-RFP. The localization of the ML1N*2-GFP probe to the lysosome is related to the lysosomal PtdIns(3,5)P2 content. Scale bar: 2 μm. The plot presents the quantification of PtdIns(3,5)P2 fluorescence on microscopy images of HeLa, scrambled and RC-kd, cotransfected with ML1N*2-GFP and LAMP1-RFP. Control cells were also treated with the PIKFYVE inhibitor YM201636 1 μM 4 h, and RC-kd were treated with AMPK activator A769662 100 μM 4 h (or DMSO as vehicle control). The plot shows the average±s.e.m ML1N*2-GFP intensity on the spots marked with LAMP1-RFP, across 45 cells for each condition, obtained from 3 independent experiments. ANOVA p-value **p < 0.005; ***p < 0.001; n.s., non-significant.
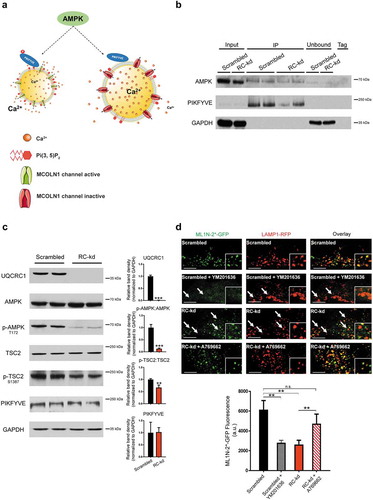
Figure 4. FLCN represses AMPK signaling in RC-kd cells. (a) Western blot analysis of whole-cell extracts for FLCN and FNIP1 in RC-kd and scrambled control HeLa cells, using GAPDH as loading control. Both proteins are more abundant in RC-kds. Column plot shows average plus standard deviation of 2 independent experiments, with duplicates in each experiment. ANOVA p-value *p < 0.05. (b) Transcript levels of FLCN, FNIP1 and FNIP2 measured by quantitative RT-PCR, in control and RC-kd cells, calculated by the ΔΔCt method using GAPDH as a control gene. Column plot shows average plus standard deviation of at least 3 independent experiments, with duplicates in each experiment. T-test p-value ***p < 0.001. (c) Western blot analysis of control and RC-kd whole-cell extracts with FLCN silencing (siRNA FLCN) or with control siRNA (siRNA ctrl), using GAPDH and HPRT as loading controls. Decrease of FLCN leads to the reactivation of AMPK signaling. Column plot shows average plus standard deviation of 2 independent experiments. T-test p-value *p < 0.05, **p < 0.01 against basal condition (scrambled+siRNA ctrl). (d) FLCN silencing in RC-kd cells normalizes lysosomal volume. Representative equatorial plane confocal images of HeLa cells (scrambled, left side; or RC-kds, right side), with FLCN silencing (bottom panel) or control siRNA (upper panel), stained with anti-LAMP1 antibody (secondary conjugated with Alexa Fluor 488 fluorophore). Scale bar: 5 μm. The column plot on the upper right panel shows the average±st.d. of the lysosomal volume across 30 cells acquired for each condition, obtained from 2 independent experiments. ANOVA p-value **p < 0.05, ***p < 0.001 (e) FLCN silencing restores lysosomal acidification in RC-kd. Representative spinning-disk microscopy images of RC-kd and scrambled control HeLa cells, with FLCN siRNA or scrambled control siRNA, stained with dextran-Oregon Green and dextran-TMRM. Scale bar: 5 μm. Dextran-Oregon Green is quenched under acidic pH, so increased green:red ratio denotes impaired lysosomal acidification. The average ± st.d green:red ratio for 30 cells from 2 independent experiments is presented in the plot on the right panel (normalized to scrambled green:red = 1). ANOVA p-value ***p < 0.001.
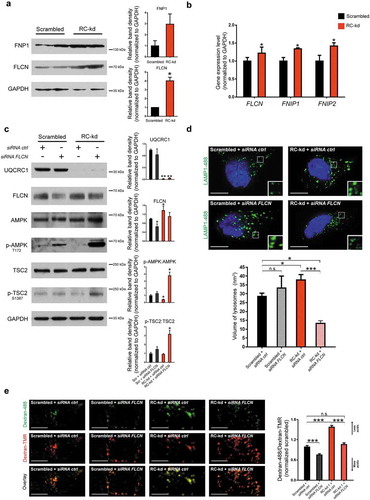
Figure 5. Impaired lysosomal function in AMPK-deficient cells. (a) Increased lysosomal volume in cells lacking AMPK activity (prkaa1 prkaa2 double-knockout MEFs, AMPK DKO). Representative equatorial plane confocal images of mouse embryonic fibroblasts derived from WT (upper panel) or AMPK DKO (lower panel) mice, transfected with LAMP1-GFP. Scale bar: 2 μm. The column plot on the right shows the average±st.d. of the lysosomal volume across at least 60 cells acquired for each condition, from 2 independent experiments. T-test p-value *p < 0.05 (b) Equatorial plane confocal images of AMPK DKO and WT MEF cells stained with dextran-Oregon Green and dextran-TMRM. Scale bar: 3 μm. Dextran-Oregon Green is quenched under acidic pH, so increased green:red ratio denotes impaired lysosomal acidification. The average ± s.e.m. green:red ratio for 40 cells from 2 independent experiments is presented in the plot on the right panel (normalized to WT green:red = 1). (c) Decreased lysosomal proteolytic capacity in AMPK DKO MEFs, which was rescued after reactivation of the lysosomal Ca2+ channel MCOLN1. The rate of DQ-BSA hydrolysis (increase of fluorescence units per min, per mg of protein) is a function of lysosomal proteases, and was measured using a plate reader over 2 h. The linear range was used to determine the rate. The average±st.d. rate for each condition (20 wells in a 96-well plate) is presented in the plot on the upper right panel. These values are a representative experiment. Three independent experiments were performed, with 20 wells per condition. ANOVA p-value *p < 0.05; n.s., non-significant. (d) Decreased activation of Magic Red dye in AMPK DKO MEFs. Magic Red freely diffuses through the cell, and upon activation in the lysosomes, it emits red fluorescence proportional to the activity of lysosomal CTSB. The AMPK DKO cells present a sharp decrease in the activation of Magic Red, which is normalized by treatment with the MCOLN1 activator MLSA1 20 µM 4 h (DMSO as vehicle control). The column plot shows the average±st.d. intensity of Magic Red signaling from 40 cells per condition from 2 independent experiments. ANOVA p-value ***p < 0.001 (e) Increased lysosomal Ca2+ in AMPK DKO MEFs. Cells are loaded with the lysosomotropic compound Gly-Phe β-naphthylamide (GPN), which readily diffuses across the cell. When entering the lysosome, GPN is activated by CTSC, and the activated product forms pores in the lysosomal membrane which allow the release of lysosomal contents to the cytoplasm, including Ca2+. The increase in cytoplasmic Ca2+ upon GPN treatment is measured by changes in the fluorescence intensity of the cytoplasmic Ca2+ indicator Fluo-4 over time. The curves obtained for Fluo-4 fluorescence intensity over time scrambled and RC-kds cells are presented in the bottom panel (average of at least 30 cells per condition; 2 independent experiments were performed), normalized to the fluorescence intensity in the first frame. The increased magnitude of the peaks are a function of increased lysosomal Ca2+contents in AMPK DKO, and the average±st.d. of the peaks are presented in the column plot below. ANOVA p-value *p < 0.05.
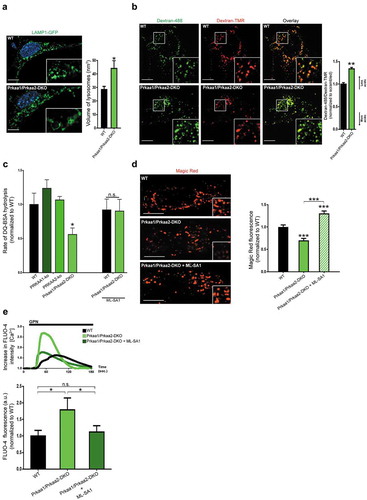
Figure 6. AMPK activation rescues lysosomal size. (a) Lysosomal enlargement in RC-kd cells is rescued by AMPK reactivation. Representative Airyscan confocal equatorial plane images of scrambled or RC-kd HeLa cells, treated with A769662 or compound C (DMSO as vehicle control), and stained with anti-LAMP1 antibody (secondary conjugated with Alexa Fluor 488 fluorophore). Scale bar: 3 μm. The measurement of the lysosomal volume across at least 40 cells obtained for each condition from 2 independent experiments, is plotted on the right panel as average±s.e.m.. ANOVA p-value *p < 0.05, **p < 0.005 and ***p < 0.001. (b) Reactivation of AMPK signaling in RC-kd restores autophagosome digestion. Western blot analysis of whole-cell extracts for LC3B in RC-kd and scrambled control HeLa cells, using GAPDH as loading control. Every condition was also subject to the treatment with the lysosomal inhibitor chloroquine, to assess the amount of autophagosomes that accumulate specifically due to lysosomal impairment. The band for LC3B-II, a marker of autophagosomal mass, is increased in RC-kds and rescued by activation of AMPK. This rescue is dependent on the activity of PIKFYVE (inhibited by YM201636). Column plot shows average±s.d. of 2 experiments. ANOVA p-value *p < 0.05 (against control condition in the absence of chloroquine, lane 1).
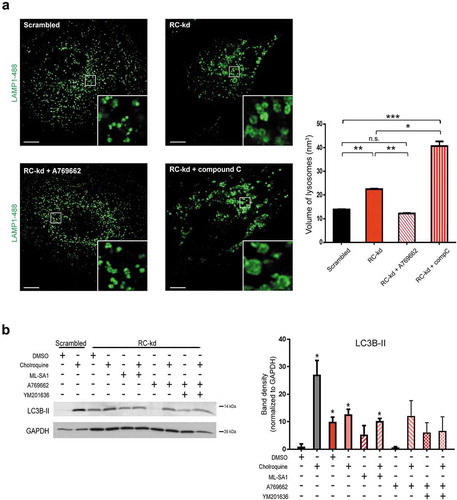
Figure 7. Cell death in RC-kd and ndufs4−/-. (a) Apoptosis and necrosis evaluation in scrambled, RC-kd and RC-kd HeLa treated with 20 μM ML-SA1 for 4 h. The cells were subject to 2 µM staurosporine for 1 h prior to collection as a mild cell death-inducing condition. Afterwards the cells were labelled with ANXA5/annexin V (a marker of apoptotic cell death that recognizes externalization of phosphatidylserine to the outer leaflet of the plasma membrane) and propidium iodide (accumulates in dead cells). Fluorescence was measured by flow cytometry; the experiment was done in triplicate. (b) Column plot showing that that RC-kd cells present more apoptosis and necrosis than the scrambled cells. Additionally, MLSA1 treatment has no effect in the apoptotic cells but significant increases the necrotic cells. The plot shows variation in the number of cells undergoing death under each condition compared to the control (fold change; scrambled = 1). ANOVA p-value *p < 0.05, **p < 0.005, ***p < 0.005 (c) Measurement of apoptosis and necrosis in ndufs4−/- and WT MEFs, as well as ndufs4−/- MEFs treated with 20 μM ML-SA1 for 4 h. The cells were subject to 2 µM staurosporine for 1 h prior to collection, as a mild cell death-inducing condition. Afterwards the cells were labelled with ANXA5 and propidium iodide, as above. Fluorescence was measured by flow cytometry; the experiment was done in triplicate. (d) Column plot showing that that ndufs4−/- cells present less apoptosis but more necrosis than the WT. Additionally, MLSA1 treatment has not effect in the apoptotic cells but significant increases the necrotic cells. The plot shows variation in the number of cells undergoing death under each condition compared to the control (fold change; scrambled = 1). ANOVA p-value *p < 0.05, **p < 0.005, ***p < 0.005, n.s. (e) Cell death decreases after long-term treatment with 20 μM MLSA1 in control and RC-kd HeLa cells. Plot shows the average±s.d. of the number of propidium iodide-positive cells per well of a 6-well plate. Three wells per condition were used per experiment, and 2 independent experiments were performed. ANOVA p-value *p < 0.05.
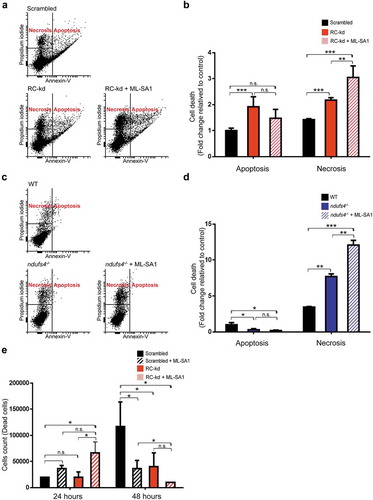
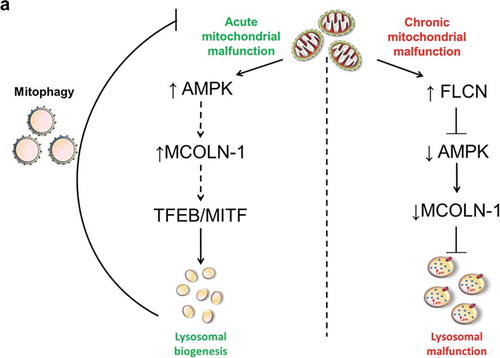
Figure 8. Model for the mechanism linking chronic mitochondrial deficiency with regulation of lysosomal function. This diagram depicts the contrast between chronic and acute mitochondrial malfunction. Acute mitochondrial defects result in an increase of AMPK activity, which promotes the pathway that activates MCOLN1 channel, while chronic mitochondrial malfunction, as shown by this study, results in increased FLCN, which represses AMPK activity resulting in decreased activity of the MCOLN1 channel. This, in turn, causes accumulation of Ca2+ in the lysosomes, alterations in lysosomal pH, enlargement of lysosomes and lysosomal malfunction.