
Figures & data
Figure 1. Genera and protein specificities of the autophagy receptors SQSTM1/p62, CALCOCO2/NDP52 and the autophagy adaptor protein MAP1LC3/LC3. (a) Definition of orthologous target groups. Orthologous targets are defined as the set of orthologous proteins which share sequence homology with each other and recognized as substrates by a particular autophagy targeting protein. (b) Number of orthologous target proteins of SQSTM1/p62, CALCOCO2/NDP52 and MAP1LC3/LC3 in single and multiple pathogen genera. (c) Comparison of bacterial proteins targeted by SQSTM1/p62, CALCOCO2/NDP52 and MAP1LC3/LC3 indicating that targeting of bacterial proteins by autophagy is mostly complementary. (d) Comparison of the studied bacterial genera targeted by SQSTM1/p62, CALCOCO2/NDP52 and MAP1LC3/LC3 showing a high overlap, which may promote efficient pathogen surveillance.
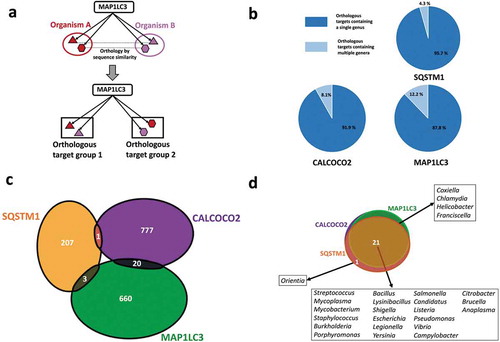
Figure 2. Virulence factor targeting features of SQSTM1/p62, CALCOCO2/NDP52 and MAP1LC3/LC3. (a) Tabular representation of the virulence factor classes targeted by the autophagy receptors and MAP1LC3/LC3. Only those bacterial genera where the targeted bacterial proteins are annotated as virulence factors are listed. (b) A network based view of the virulence factors (outer ring) and the corresponding virulence functions (inner ring) targeted by the autophagy proteins. We colored the virulence functions based on the associations between the autophagy targeting proteins and virulence factors. Whereas some of the virulence functions are targeted by only 1 particular autophagy targeting protein, other functions are targeted by multiple autophagy targeting proteins (in black).
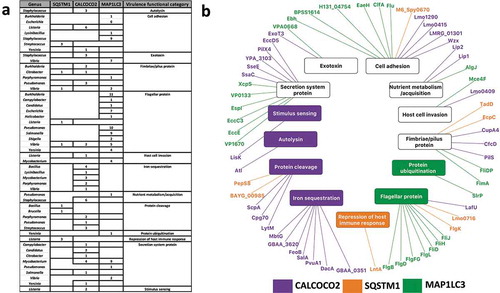
Figure 3. Pathogenic modulation of autophagy and the bi-directional interplay (a) Heat map showing the phase-specific regulation of autophagy by various bacterial genera. Hypergeometric distribution was used to determine the over-representation of proteins from each bacterial genus in our study and show those predicted (based on domain-domain and domain-motif interactions) to modulate proteins functioning in 1 or multiple phases of the core autophagy process. The significance score is determined as the -log10 function of the corrected hypergeometric distribution based enrichment P-value. (b) Interplay between autophagy receptors and their target bacterial effectors, which regulate different phases of autophagy. The donut plots display the phase classification of the core autophagy proteins targeted by each bacterial effector protein, and the total number of host autophagy proteins targeted by the bacterial effector is indicated by the bold number within the donut plot. The thickness of the arrows from SQSTM1/p62, CALCOCO2/NDP52 and MAP1LC3/LC3 denote the number of orthologs of the targeted bacterial effector. (c) An example of the interplay between host autophagy and the protease YhjJ from Salmonella typhimurium SL1344.
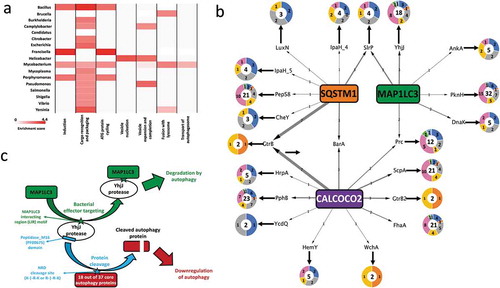
Figure 4. Salmonella YhjJ protease interacts with MAP1LC3B/LC3B (a) GST affinity-isolation assay between recombinant GST-MAP1LC3B/LC3B and His-YhjJ. Upper panel: immunoblot against 6xhistine-tagged YhjJ; lower panel: Ponceau S staining. (b) Quantification of the enrichment of His-YhjJ based on 3 independent replicates. (c, d) Illustration of events of complete co-localization (c) adjacent localization (d, arrowhead) or no co-localization (d, arrow) between GFP-tagged S. Typhimurium (green) and MAP1LC3B/LC3B (red). Nuclei are stained with DAPI (blue). Scale bars: 10 µm. (e) Quantification of the ‘co-localization index’ (see Materials and Methods section). (f-i) Representative single HT-29 cell pictures from cells infected with ∆sifA (f) ∆sifA∆yhjJ (g) wild type (h) or ∆yhjJ S. Typhimurium (i). (j) Quantification of the number of MAP1LC3B/LC3B dots per individual cell. Bar charts show mean ± s.d. Statistical significance was determined using Students’ t-test (b) or one-way ANOVA (e, j), **P < 0.01, ***P < 0.001, ****P < 0.0001. For a full description of the statistics, refer to Table S8.
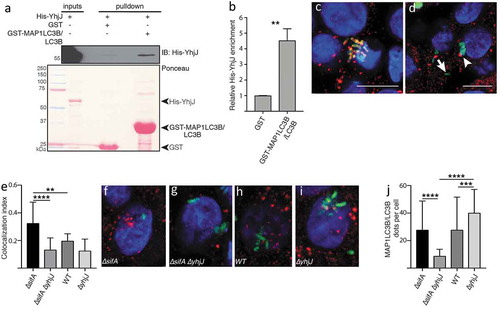
Table 1. Oligonucleotides used in this study.
Table 2. Bacterial strains used in this study.