Figures & data
Figure 1. NLRP3 inflammasome activation correlates with PD progression. (a) i-ii: ELISA analysis of IL1B and CASP1 secretion in the serum of the saline and MPTP/p PD mouse model. Data are representative of eight independent experiments (means ± SEM, n = 6). **P < 0.01 vs. control group, as determined by the Student’s t-test. (b) Expression of pro-CASP1, CASP1, pro-IL1B and IL1B in the midbrain extracts of the indicated mice, and the densitometric analysis is shown in (c). Data are representative of 4 independent experiments (means ± SEM). ***P < 0.001 vs. control group, as determined by the Student’s t-test. (d) Expression of NLRP1, NLRP2, NLRP3, NLRC4 and AIM2 in the midbrain extracts of NC and MPTP/p mice. Densitometric analysis of protein expression levels in the acute MPTP (e) and subacute MPTP/p (f) PD model midbrains. Data are representative of four independent experiments (means ± SEM). *P < 0.05, **P < 0.01, ***P < 0.001 compared with the corresponding saline group, as determined by the Student’s t-test. (g) The midbrain sections of subacute MPTP/p mice were fixed and analyzed by immunofluorescence for NLRP3 and TH expression levels. Appropriate magnifications were selected, as indicated by the scale bars. Data are representative of 3 independent experiments (means ± SEM). **P < 0.01 compared with the saline group, as determined by the Student’s t-test.
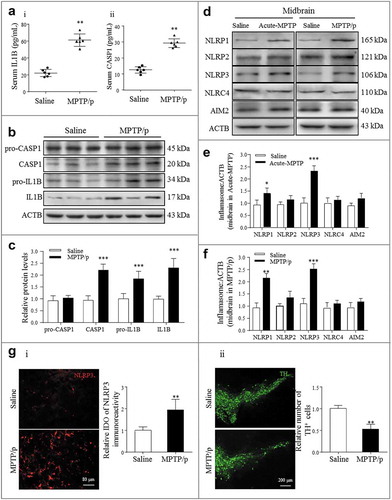
Figure 2. Ka prevents neurodegeneration in an inflammation-associated PD model. (a) Schedule of animal treatments. Four-month-old C57BL/6 mice were intraperitoneally treated with dimethyl sulfoxide (vehicle) or Ka (25, 50 or 100 mg.kg−1 body weight) daily during the experiment period. Three days later, the inflammatory responses were induced by one LPS (0.5 μg, bilaterally) microinjection into the SNpc. (b) Immunohistochemical staining for TH (tyrosine hydroxylase) on the ventral mesencephalon of mice treated with LPS plus (or) Ka. Scale bar: 200 μm. (c) Quantitative data of the TH+ neurons described in (b). (d and e) Western blotting analysis of TH in both mesencephalon and striatum extracts of experimental mice, with densitometric analysis shown in (f). (g) Rotarod test and pole test of mice. i: Rotarod test in different groups (n = 8) at the end of the experiment, which was continuously performed for 3 days. ii: Pole test in mice (n = 8). Data in (c, f and g) are representative of three independent experiments (means ± SEM). #P < 0.05, ##P < 0.01 vs. control group, as determined by the Student’s t-test, ns.P > 0.05, *P < 0.05, **P < 0.01 vs. LPS group, as determined by the Student’s t-test. Ka, kaempferol.
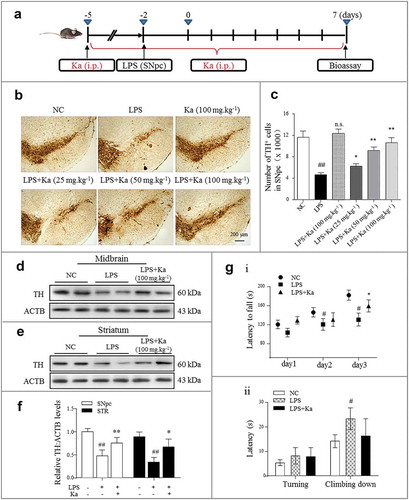
Figure 3. Ka attenuates neuroinflammation in an LPS-induced PD mouse model. (a and b) Differential inflammatory protein expression levels in the midbrain were measured post LPS challenge by western blotting and quantitative analysis. (c) ELISA analysis of IL1B level in the midbrain extracts of mice treated with LPS or LPS plus Ka (25, 50 or 100 mg.kg−1 body weight, daily, i.p.). (d) Representative sections (ventral mesencephalon, SNpc) prepared from brain tissues were stained with the microglia marker AIF1. (Upper and lower right magnified images represent resting and activated microglia, respectively.) Scale bars represent the indicated length. (e) Quantitative analysis of the activated microglia described in (d). Data in (b and e) are representative of 3 independent experiments with replications. Data in (c) are representative of 4 independent experiments (means ± SEM. n = 4). n.s.P > 0.05, #P < 0.05, ##P < 0.01, ###P < 0.001 vs. control group, as determined by the Student’s t-test. *P < 0.05, **P < 0.01, ***P < 0.001 vs. LPS group, as determined by the Student’s t-test. Ka, kaempferol.
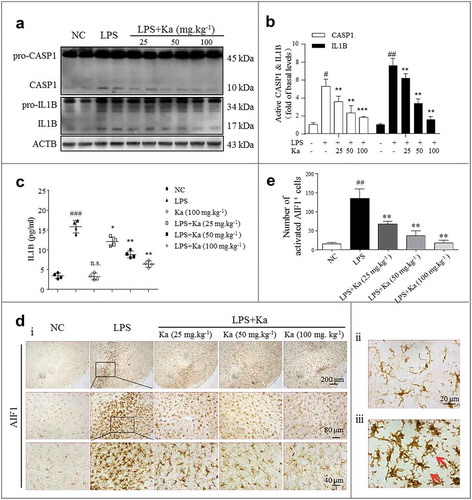
Figure 4. Ka attenuates neuroinflammation in a transgenic model of PD. (a) Diagram of the experimental design. Seven-month-old A53Ttg/tg mice and matched WT control mice were grouped as indicated. All mice were treated with dimethyl sulfoxide (vehicle) or Ka (100 mg.kg−1 body weight, i.p.) daily during the experimental period. Mice were transcardially perfused at the endpoint. (b and d) The expression of TH, SNCA and AIF1 were analyzed by immunochemistry in the midbrain sections, and the statistical data are shown on the right. Scale bars are as indicated. Quantification of SNCA immunofluorescence intensity using ImageJ software. IOD, integrated optical density. (c) The protein levels of TH and SNCA in the midbrain tissues were examined by western blotting (c i), and the statistical data are shown in (c ii-iii). (e) The expression levels of NLRP3 and CASP1/p10 in the midbrain were examined by western blotting (e i), and the statistical data are shown in (e ii-iii). Data in (b, c, d and e) are presented as the means ± SEM (n = 5–6). #P < 0.05, ##P < 0.01, ###P < 0.001 vs. WT-vehicle group by one-way ANOVA. n.s.P > 0.05, *P < 0.05, **P < 0.01 vs. A53Ttg/tg-vehicle group, as determined by one-way ANOVA. Ka, kaempferol.
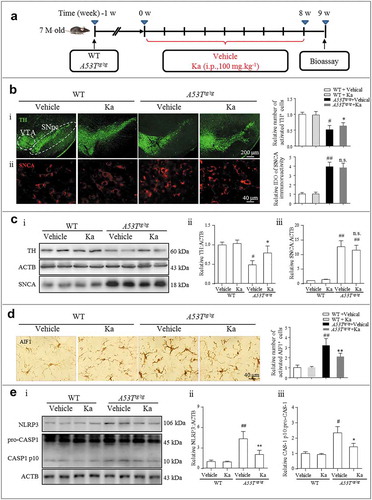
Figure 5. NLRP3 inflammasome inhibition accounts for the anti-inflammatory effect of Ka. (a) NLRP3 protein expression in the midbrain was measured by western blotting and the quantitative analysis data shown in (b). Data are representative of 3 independent experiments (means ± SEM). ##P < 0.01 vs. control group, *P < 0.05, **P < 0.01 vs. LPS group, as determined by the Student’s t-test. (ci) NLRP3 expression was analyzed by immunohistofluorescence (IHF) and counterstained with DAPI in the midbrain sections of the indicated mice. Scale bar as indicated. (cii) Localization analysis showed that NLRP3 immunoactivity was mainly in the microglia. (ciii) Quantification of NLRP3 immunofluorescence intensity using ImageJ software. IOD, integrated optical density. Data shown are representative of 3 experiments (means ± SEM, n = 4). ###P < 0.001 vs. control group, **P < 0.01 vs. LPS group, as determined by the Student’s t-test. (D and E) LPS-primed primary microglia from WT mice were cultured with (or without) Ka (40 μM) for 5 h, followed by a 30-min incubation with ATP (5 mM). NLRP3 in the cell extracts was analyzed by immunoblotting, and supernatants were analyzed by ELISA for IL1B maturation (e). (f) Primary microglia from nlrp3+/+ and nlrp3−/- mice were treated as described in (e); NLRP3 expression and IL1B secretion were then measured by western blotting. Data in (d and e) are representative of 4 to 5 independent experiments with repetitions (means ± SEM). ###P < 0.001 vs. NC group, **P < 0.01 vs. LPS- and (or) ATP-stimulated group by one-way ANOVA. Ka, kaempferol.
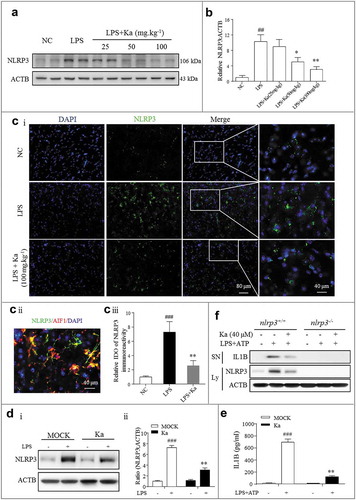
Figure 6. Ka inhibits CASP1 activation and IL1B maturation by interrupting NLRP3 inflammasome formation in vitro. (a) LPS-primed primary microglia were treated with different doses of Ka for 5 h and then stimulated with ATP for 30 min. Supernatants (SN) and cell extracts were analyzed by immunoblotting (Ai), and the quantitative analysis of activated CASP1/p10 is shown in Aii. (b) SN samples from (a) were analyzed by ELISA for IL1B maturation. Data in (a and b) are representative of 5 independent experiments with repetitions (means ± SEM). *P < 0.05, **P < 0.01, ***P < 0.001 vs. ATP group by the Student’s t-test. (c) LPS-primed BV2 cells were treated with Ka (40 μM) and then stimulated with ATP, nigericin or MSU. SN and cell extracts (lysate) were analyzed by immunoblotting, and the quantitative analysis of activated CASP1/p10 and IL1B is shown in (Cii). Data are representative of 3 independent experiments with repetitions (means ± SEM). **P < 0.01,***P < 0.001 vs. NC group, as determined by the Student’s t-test. (d) LPS-primed BV2 cells were treated with 40 μM Ka for 5 h, followed by a 30-min incubation with or without ATP (5 mM); the immunoblotting analysis was performed as described in (c). (e and f) LPS-primed BV2 cells were treated with 40 μM Ka and then stimulated with ATP. The NLRP3 complex specks were indicated by immunocytofluorescence (f), and the NLRP3-PYCARD interaction was analyzed by immunoprecipitation and immunoblotting (e). Scale bar: 20 μm. Data in (f) are representative of 3 independent experiments with repetitions (means ± SEM). ###P < 0.001 vs. control group, **P < 0.01 vs. ATP group, as determined by the Student’s t-test. Ka, kaempferol; SN, supernatant; Ly, lysate.
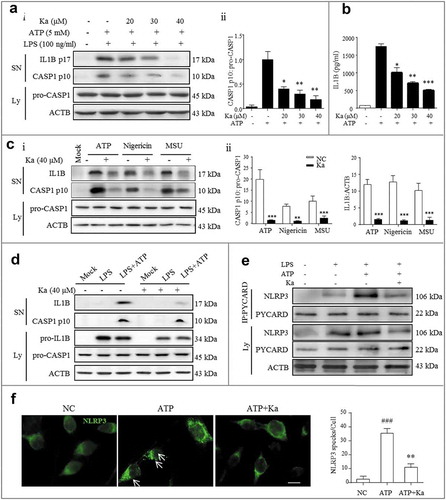
Figure 7. Ka promotes NLRP3 protein autophagic degradation, which inhibits NLRP3 inflammasome activation. (a) Immunoblotting analysis of NLRP3, PYCARD, pro-CASP1, and ACTB from LPS-primed BV2 cells treated with various doses of Ka for 5 h. Data are representative of 4 independent experiments with repetitions (means ± SEM). ###P < 0.001 vs. control group, as determined by the Student’s t-test. *P < 0.05, **P < 0.01 vs. LPS group, as determined by the Student’s t-test. (b) Immunoblotting analysis of NLRP3, PYCARD, and pro-CASP1 from LPS-primed BV2 cells treated with 40 μM Ka for 5 h and then stimulated with or without ATP for 30 min. Data are representative of 3 independent experiments with repetitions (means ± SEM). ###P < 0.001 vs. control group, as determined by the Student’s t-test. *P < 0.05, **P < 0.01 vs. LPS group, as determined by the Student’s t-test. n.s.P > 0.05 vs. corresponding MOCK group by one-way ANOVA, followed by the Holm-Sidak test. (c) LPS-primed BV2 cells were cultured with MG-132 (10 μM) or 3-MA (5 mM) for 1 h and then treated with Ka (40 μM) for 5 h, followed by a 30-min incubation with 5 mM ATP. Supernatants (SN) and cell extracts (lysate) were analyzed by immunoblotting. (d) Immunoblotting analysis of MAP1LC3B and ACTB levels in cell lysates from LPS-primed BV2 cells cultured with 3-MA (5 mM), BafA1 (100 nM) or CQ (10 μM) and then treated with Ka (40 μM) for 5 h. Data in (c and d) are representative of 3 independent experiments with repetitions (means ± SEM). ###P < 0.001 vs. control group, as determined by the Student’s t-test. **P < 0.01 vs. LPS group, as determined by the Student’s t-test. &P < 0.05, &&P < 0.01 vs. Ka group by one-way ANOVA, followed by the Holm-Sidak test. Ka, kaempferol.
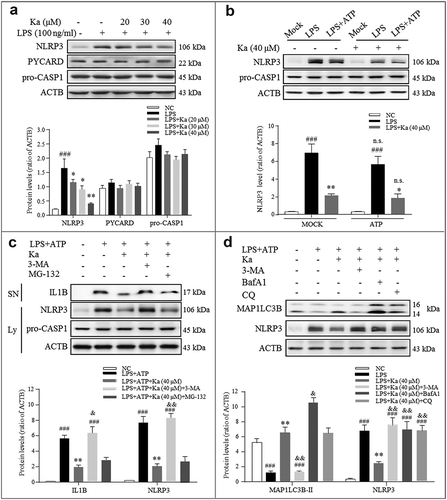
Figure 8. Ka induces autophagy to inhibit NLRP3 activation in microglia. (a) The expression of SQSTM1, ATG5, ATG7 and MAP1LC3B induced by Ka in primary mouse microglia. Cells were treated with Ka (20, 30, 40 μM) for 6 h. (b) Densitometric data of SQSTM1, ATG5, ATG7 and M AP1LC3B-II expression using ImageJ. Data are presented as the means ± SEM of 4 independent experiments with repetitions. #P < 0.05 vs. LPS group, as determined by the Student’s t-test; *P < 0.05 and **P < 0.01 vs. the LPS + Ka (40 μM) group, as determined by the Student’s t-test. (c) Effect of Ka on the formation of MAP1LC3B puncta. LPS-primed cells were treated with Ka (40 μM) for an additional 12 h. MAP1LC3B puncta were then analyzed by confocal microscopy. Scale bar: 10 μm. The number of puncta per cell is presented as the means ± SEM of 5 independent experiments with repetitions. #P < 0.05, ##P < 0.01 vs. NC group, *P < 0.05 vs. Ka group, as determined by the Student’s t-test. (d) HEK293T cells were infected with an RFP-GFP-MAP1LC3B adenovirus and were then treated with 40 μM Ka (with or without BafA1 [100 nM] or rapamycin [10 nM] as a positive control for 12 h. Effects of Ka on RFP- and GFP-MAP1LC3B puncta (left panel). Scale bar: 10 μm. The number of RFP- and GFP-MAP1LC3B puncta per cell was counted, and the results are shown in the right panel. The number of puncta per cell is presented as the mean ± SEM of 4 independent experiments with repetitions. #P < 0.05, ##P < 0.01 vs. the NC group; *P < 0.05, **P < 0.01 vs. the Ka group, && P < 0.01 vs. the BafA1 group, as determined by one-way ANOVA, followed by the Holm-Sidak test. (e) MAP1LC3B-II and SQSTM1 levels were analyzed by western blotting of LPS-primed BV2 cells treated with Ka (with or without BafA1) and rapamycin. Data are presented as the means ± SEM of three independent experiments with repetitions. #P < 0.05, ###P < 0.001 vs. the NC group; **P < 0.01, ***P < 0.001 vs. the LPS group. Ka, kaempferol.
![Figure 8. Ka induces autophagy to inhibit NLRP3 activation in microglia. (a) The expression of SQSTM1, ATG5, ATG7 and MAP1LC3B induced by Ka in primary mouse microglia. Cells were treated with Ka (20, 30, 40 μM) for 6 h. (b) Densitometric data of SQSTM1, ATG5, ATG7 and M AP1LC3B-II expression using ImageJ. Data are presented as the means ± SEM of 4 independent experiments with repetitions. #P < 0.05 vs. LPS group, as determined by the Student’s t-test; *P < 0.05 and **P < 0.01 vs. the LPS + Ka (40 μM) group, as determined by the Student’s t-test. (c) Effect of Ka on the formation of MAP1LC3B puncta. LPS-primed cells were treated with Ka (40 μM) for an additional 12 h. MAP1LC3B puncta were then analyzed by confocal microscopy. Scale bar: 10 μm. The number of puncta per cell is presented as the means ± SEM of 5 independent experiments with repetitions. #P < 0.05, ##P < 0.01 vs. NC group, *P < 0.05 vs. Ka group, as determined by the Student’s t-test. (d) HEK293T cells were infected with an RFP-GFP-MAP1LC3B adenovirus and were then treated with 40 μM Ka (with or without BafA1 [100 nM] or rapamycin [10 nM] as a positive control for 12 h. Effects of Ka on RFP- and GFP-MAP1LC3B puncta (left panel). Scale bar: 10 μm. The number of RFP- and GFP-MAP1LC3B puncta per cell was counted, and the results are shown in the right panel. The number of puncta per cell is presented as the mean ± SEM of 4 independent experiments with repetitions. #P < 0.05, ##P < 0.01 vs. the NC group; *P < 0.05, **P < 0.01 vs. the Ka group, && P < 0.01 vs. the BafA1 group, as determined by one-way ANOVA, followed by the Holm-Sidak test. (e) MAP1LC3B-II and SQSTM1 levels were analyzed by western blotting of LPS-primed BV2 cells treated with Ka (with or without BafA1) and rapamycin. Data are presented as the means ± SEM of three independent experiments with repetitions. #P < 0.05, ###P < 0.001 vs. the NC group; **P < 0.01, ***P < 0.001 vs. the LPS group. Ka, kaempferol.](/cms/asset/448f9645-d20e-4d92-ab0d-d063deb4fe35/kaup_a_1596481_f0008_oc.jpg)
Figure 9. Ka-promoted ubiquitination is responsible for NLRP3 degradation. (a) LPS-primed BV2 cells were treated with 40 μM Ka for 5 h, followed by treatment with 5 mM ATP for 30 min. Cells were analyzed by NLRP3 and ubiquitin immunofluorescence. Scale bar: 40 μm. (b) LPS-primed-BV2 cells were treated with Ka (40 µM). Immunoblotting analysis of Ub protein levels in cell lysates immunoprecipitated with NLRP3 antibody. (c) LPS-primed BV2 cells were cultured with 3-MA (5 mM) or LY294002 (10 µM) for 1 h and then treated with Ka (40 μM) for 5 h. Immunoblotting analysis of Ub protein levels in cell lysates immunoprecipitated with NLRP3 antibody. (d) LPS-primed BV2 cells were cultured with MG-132 (10 μM) and then treated with Ka (40 μM) for 5 h. Immunoblotting analysis of Ub proteins in cell lysates immunoprecipitated with NLRP3 antibody. (e) HEK293T cells expressing Flag-NLRP3 were treated with 3-MA (5 mM) or LY294002 (10 µM) for 1 h and then treated with Ka (40 μM) for 5 h. Flag-NLRP3 immunoprecipitate was analyzed for ubiquitination. (f) LPS-primed BV2 cells were cultured with Z-YVAD (10 μM) and then treated with Ka (40 μM) for 5 h. Immunoblotting analysis of Ub proteins in cell lysates immunoprecipitated with NLRP3 antibody.
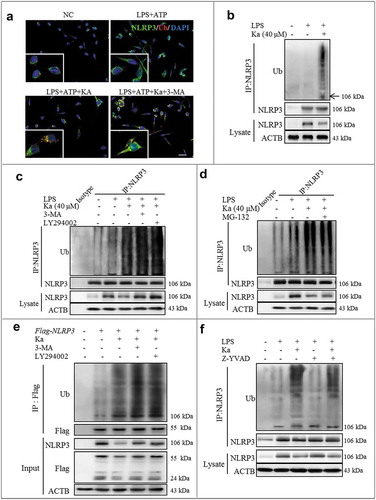
Figure 10. Ka and autophagy signaling prevent LPS-induced NLRP3 inflammasome-related neurodegeneration in vivo. Mice were treated with stereotaxic LPS injections into the SNpc to induce neuroinflammation. Ka (100 mg.kg−1) was administered i.p. daily beginning 3 days before the LPS challenge. 3-MA (10 mg.kg−1) was administered (i.p., 12 h before Ka) daily during the experiment. Mice were sacrificed 7 days after the LPS induction. Values are the means ± SEM of 6 mice per group. (a) Microglia activation was examined by IHC detection of AIF1. (b) The NLRP3, CASP1, IL1B, MAP1LC3B and ACTB protein levels in the midbrain homogenates from the indicated mice were examined by immunoblotting. Statistical data of the NLRP3 and CASP1 expression levels from 6 mice are shown in (c). Data are representative of three independent experiments (means ± SEM). n.s.P > 0.05, *P < 0.05, **P < 0.01 vs. LPS group, as determined by the Student’s t-test; &P < 0.05 vs. LPS + Ka group, as determined by the Student’s t-test. (d) Expression of TH-positive DA neurons was examined by IHC staining of midbrain sections. (e) Formation of MAP1LC3B puncta in ITGAM/CD11b+ microglia in vivo was examined by IHF staining of midbrain sections and then analyzed by confocal microscopy. Scale bar is as indicated. Data in Aii, Dii and Eii are representative of 3 independent experiments (mean ± SEM, n = 4). ns.P > 0.05, #P < 0.05, ##P < 0.01 vs. NC group, **P < 0.01 vs. LPS group,,&P < 0.05 vs. LPS + Ka group, as determined by the Student’s t-test.
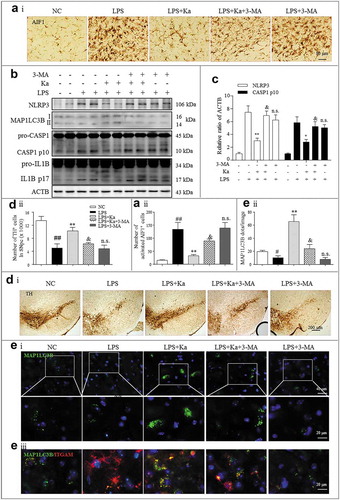
Figure 11. Atg5 knockdown blunted Ka-conferred neuroprotective effects in vivo. The SNpc of mice were transfected with AAV-EGFP-shRNA against Atg5 or Control (1 μl of 1013 viral genomes μl−1, bilaterally), followed by LPS injury or Ka treatment, as described previously. (a) Atg5 transfection was verified by IHF and knockdown was confirmed using immunoblotting. Nuclei staining of brain sections from mice expressing EGFP/shAtg5 are shown. Atg5 knockdown causes a reduction of ATG5 in both the midbrain and striatum. (b) Western blotting and densitometric analysis of TH in mesencephalon extracts of experimental mice. Data are representative of 3 independent experiments (mean ± SEM). ##P < 0.01 vs. corresponding NC group, n.s. P > 0.05, **P < 0.01 vs. corresponding LPS group, as determined by Student’s t-test. && P < 0.01 vs. shCtl LPS + Ka group by one-way ANOVA, followed by the Holm-Sidak test. (c) TH-positive DA neurons were examined by IHC staining in midbrain sections. Scale bar is as indicated. (d) NLRP3-CASP1 activation in the midbrain was analyzed by immunoblotting, as indicated. Values represent the means ± SEM of 4 mice per group. Data are representative of 3 independent experiments. #P < 0.05, ##P < 0.01 vs. the corresponding NC group, as determined by the Student’s t-test. **P < 0.01 vs. shCtl LPS + Ka group, as determined by one-way ANOVA, followed by the Holm-Sidak test.
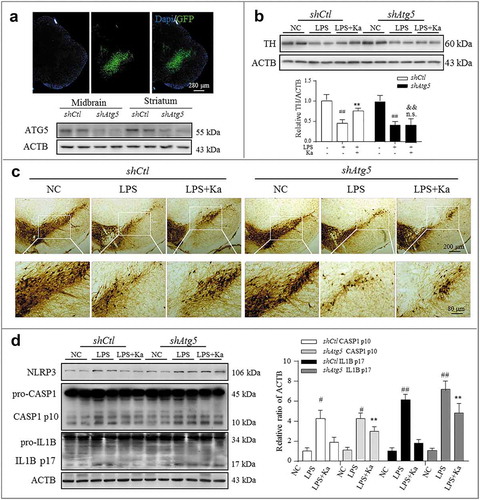
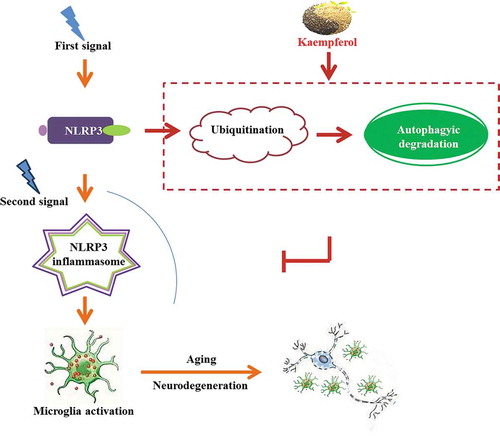
Figure 12. Schematic diagram: Kaempferol, a naturally derived small molecule, functions as both a ubiquitination and autophagy promoter to degrade and reduce NLRP3 expression, which inhibits microglia activation and, consequently, the neurodegenerative process via NLRP3 inflammation deactivation.