Figures & data
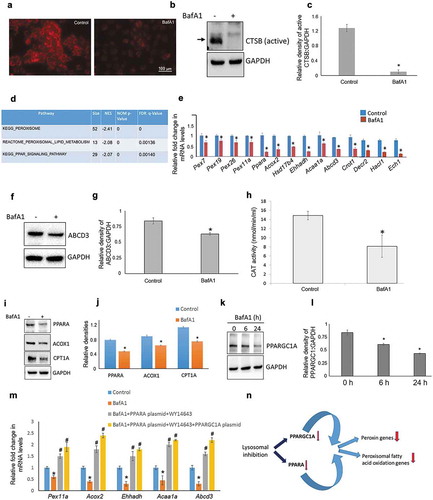
Figure 1. Lysosomal inhibition impairs peroxisomal gene expression. (a) Lysotracker staining of AML12 cells treated with ± BafA1(10 nM/24 h). (b and c) Representative immunoblot and densitometry showing cellular levels of active CTSB± BafA1 (10 nM/24 h). Values are means ±SD (n = 3), *P < 0.05. (d) Gene ontology-KEGG & Reactome Pathway analysis of the genes obtained from AML12 cells ± BafA1 (10 nM/24 h). (e) qRT-PCR validation of peroxisomal genes ± BafA1 (10 nM/24 h) in AML12 cells. Values are means ±SD (n = 3), *P < 0.05. (f and g) Representative immunoblot and densitometry analysis showing cellular levels of active ABCD3 levels ± BafA1 (10 nM/24 h). Values are means ±SD (n = 3), *P < 0.05. (h) Catalase (CAT) activity ± BafA1 (10 nM/24 h) in AML12 cells. Values are means ±SD (n = 5), *P < 0.05. (i and j) Representative immunoblot and densitometry showing cellular levels of PPARA, ACOX1 and CPT1A ±BafA1 (10 nM/24 h). Values are means ±SD (n = 3),*P < 0.05. (k and l) Representative Immunoblot and densitometry showing protein levels of PPARGC1A ±BafA1 (10 nM) for indicated time of treatment. Values are means ±SD (n = 3), *P < 0.05. (m) qRT-PCR results showing the effect of PPARA, PPARGC1A overexpression on peroxisomal gene transcription in the presence of BafA1. Briefly, cells were transfected with 500 ng of PPARA- and/or PPARGC1A-expressing plasmids using Lipofectamine 3000 and after 24 h of transfection BafA1 (10 nM) was added with or without WY14643 (15 µM, PPARA agonist) for the next 24 h before RNA isolation. Values are means ±SD (n = 3), *P < 0.05 between BafA1 vs Control, #P < 0.05 between PPARA/PPARGC1A overexpression vs. BafA1 group. (n) Model for lysosomal inhibition-induced peroxisomal defect. Based on our results we propose that pharmacological inhibition of lysosomes leads to reduced PPARGC1A and PPARA levels in cells. This reduction may explain the observed attenuation in the expression of peroxisomal genes.