Figures & data
Figure 1. SNX10 is down regulated in tumor tissues of CRC patients and closely related to clinicopathological factors. (A and B) Representative immunoblots and IHC images of SNX10 in tumor tissues (T) and paired adjacent normal tissues (ANT; N) of CRC patients. Scale bar in (B): 100 μm. (C) SNX10 mRNA levels in TT and paired ANT from 70 CRC patients were measured using RT-qPCR. (D) The ratio of SNX10 mRNA level in TT to paired ANT was calculated, and its clinical correlations with clinicopathological factors were analyzed. (E) The Kaplan-Meier survival curve of 70 CRC patients grouped based on the levels of SNX10 expression in tumor tissues. Survival analysis was performed using log-rank test. Right panel: Representative IHC images of SNX10 in tumor tissues. Scale bar: 100 μm. Data are represented as mean ± SEM (B, C) or median with upper/lower quartile and maximum/minimum values (D). NS, not significant; *, p < 0.05; **, p < 0.01; ***, p < 0.001; by 2-tailed, unpaired t-test.
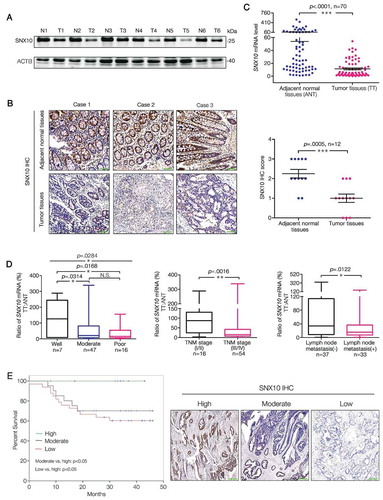
Figure 2. SNX10 deficiency protects against colitis but enhances tumor growth due to increased STAT3 activation in colorectal epithelial cells. (A) From left to right: Representative photograph of tumors in colorectum of control and snx10-cKO CRC mice; Representative H&E images of CRC tissues from control and snx10-cKO mice; Tumor size and number were measured (n = 8). Scale bar: 200 μm. (B) Left panel: Weight loss of mice was measured daily and expressed as the average percentage of initial body weight (n = 10). Middle panel: Length of colons from control and snx10-cKO mice was measured at day 15 of the CAC model. Right panel: Representative H&E images of colon inflammation of control and snx10-cKO mice at day 15. Scale bar: 500 μm. (C) Relative cytokine mRNA levels in colorectal epithelium from control and snx10-cKO mice at day 0 and day 15 (n = 10). (D) Representative immunoblots of the indicated proteins in colorectal epithelium at the indicated times. (E and F) Representative IHC images of p-STAT3 and MKI67 in colorectum at day 0 and day 15 from control and snx10-cKO mice. Scale bar: 500 μm. Data are represented as mean ± SEM. NS, not significant; *, p < 0.05; **, p < 0.01; ***, p < 0.001; by 2-tailed, unpaired t-test.
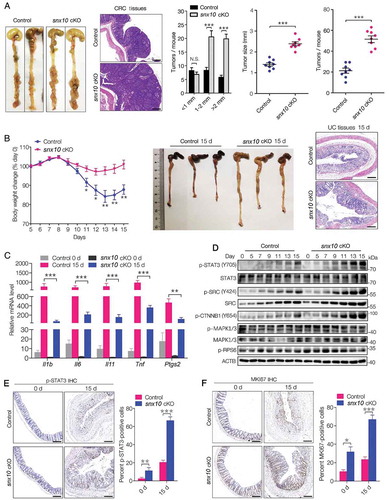
Figure 3. SNX10 deficiency enhances the activation of SRC-mediated STAT3 and CTNNB1 signaling in tumors and promotes colon cancer cell proliferation and survival. (A) Representative immunoblots of indicated proteins in tumor tissues (T) and paired adjacent normal tissues (N) of CRC patients. (B) Representative immunoblots of indicated proteins in normal colorectal epithelium and CRC tissues from control and snx10-cKO mice. (C–E) Representative IHC images of SNX10, p-SRC (Y419), p-STAT3 (Y705) and p-CTNNB1 (Y654) in human CRC tissues, and the clinical relevance of the expression of indicated proteins in human CRC tissues. Scale bar: 100 μm. (F) The colony-forming ability of WT, SNX10 knockout Caco-2 cells and SNX10 knockout Caco-2 cells infected with Ad-vector or Ad-SNX10. Right panel: Quantification of colony numbers. Data are represented as mean ± SEM. *, p < 0.05; **, p < 0.01; ***, p < 0.001; by Fisher’s exact test (D and E) and 2-tailed, unpaired t-test (F).
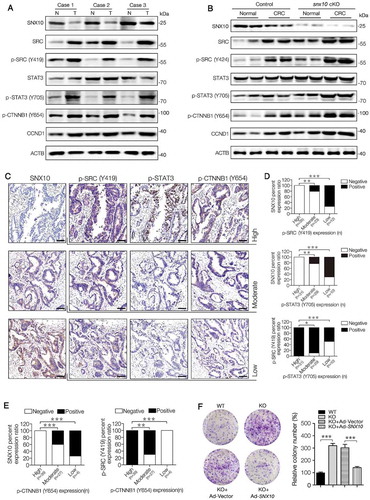
Figure 4. Impaired autophagic degradation of SRC is responsible for the accumulation and overactivation of SRC caused by SNX10 deficiency. (A and B) Src mRNA and the indicated proteins levels in normal colorectal epithelium and CRC tissues from control and snx10-cKO mice were measured by RT-qPCR and immunoblot. (C) Representative immunoblots of indicated proteins in tumor tissues (T) and paired adjacent normal tissues (N) from CRC patients. (D) WT and SNX10 knockout Caco-2 cells and SNX10 knockout Caco-2 cells infected with Ad-Vector or Ad-SNX10 were subjected to EBSS for the indicated duration and then harvested for immunoblotting analysis. SRC levels were quantified by densitometry (Lower panel). (E) WT and SNX10 knockout Caco-2 cells transfected with non-targeting siRNA (Si-NC) or ATG5-siRNA (Si-ATG5) were treated with EBSS for 6 h, followed by immunoblotting experiment. (F) Caco-2 cells transfected with non-targeting siRNA (Si-NC) or ATG5-siRNA (Si-ATG5) were subjected to starvation for the indicated duration and harvested for immunoblotting analysis. SRC levels were quantified (Lower panel). Data are represented as mean ± SEM. NS, not significant; *, p < 0.05; **, p < 0.01; ***, p < 0.001; by 2-tailed, unpaired t-test.
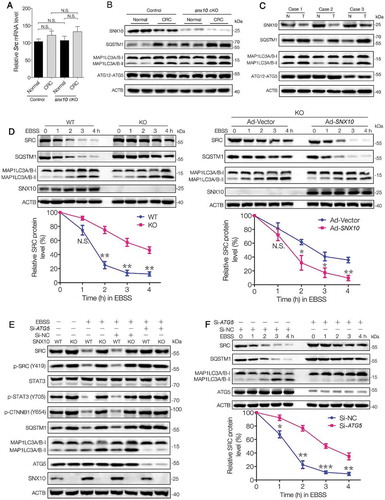
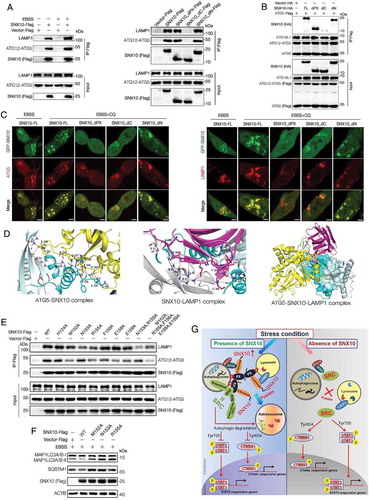
Figure 5. SNX10 interacts with SRC and recruits it to autophagosomes for degradation. (A) Cell lysates of SNX10-Flag transfected HCT116 cells were subjected to immunoprecipitation. (B) Cell lysates of SNX10-Flag transfected HCT116 cells treated with or without EBSS for 3 h were subjected to immunoprecipitation. (C) HCT116 cells expressing GFP-SNX10 were treated with or without EBSS for 3 h, followed by confocal imaging analysis. Scale bar: 5 μm. Colocalization of GFP-SNX10 and SRC were quantified. (D) Left panel: Lysates of Flag-tagged full-length SNX10 or its different truncated mutants transfected HCT116 cells were subjected to immunoprecipitation. Right panel: Lysates of MYC-tagged full-length SRC or its different truncated mutants transfected HCT116 cells were subjected to immunoprecipitation. (E) Total and autophagosome-associated proteins from WT and SNX10 knockout HCT116 cells treated with or without EBSS for 3 h were isolated and subjected to immunoblotting analysis. SRC and p-SRC were quantified by densitometry (right panel). (F) WT and SNX10 knockout HCT116 cells were treated with or without EBSS for 3 h, followed by confocal imaging analysis. Scale bar: 10 μm. Right panel: Internalized SRC and colocalized MAP1LC3 and SRC were quantified. Data are obtained by assessing at least 200 cells from three independent experiments (C and F) and represented as mean ±SEM. NS, not significant; *, p < 0.05; **, p < 0.01; ***, p < 0.001; by 2-tailed, unpaired t-test (C, E, F).
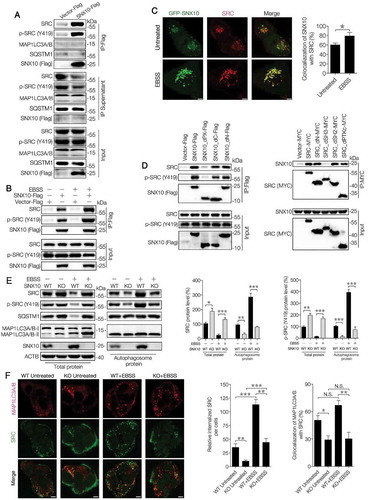
Figure 6. SNX10 is up-regulated during autophagy induction and required for autophagosome-lysosome fusion. (A) HCT116 cells were treated with EBSS or PP242 (1 μM) for 0, 1, 2, 3 or 4 h, followed by immunoblotting analysis. (B) HCT116 cells were treated with EBSS or PP242 (1 μM) for 3 h and SNX10 mRNA level was determined by RT-qPCR. (C) Representative immunoblots of indicated proteins in WT and SNX10 knockout HCT116 cells at 3 h following exposure to EBSS or PP242 (1 μM), with or without CQ (50 μM) treatment. (D) WT and SNX10 knockout HCT116 cells 72 h after infection of StubRFP-SensGFP-MAP1LC3 lentivirus were treated with EBSS and/or CQ (50 μM) for 3 h, then autophagic flux was examined. Scale bar: 10 μm. (E) Intensity of MAP1LC3 punctate in (D) was analyzed. (F) Autophagosomes in starved WT and SNX10 knockout HCT116 cells were analyzed using transmission electron microscope. The arrows indicate double- or multi-membrane autophagosomes. Scale bars, 1 μm. Right panel: Quantification of at least 100 cells from three independent experiments. Data are represented as mean ± SEM. NS, not significant; **, p < 0.01; ***, p < 0.001; by 2-tailed, unpaired t-test.
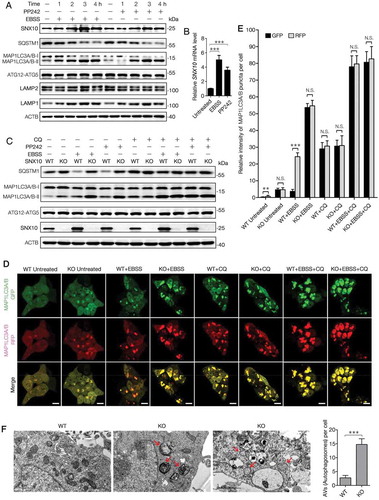
Figure 7. Both PX-domain and C-terminus of SNX10 are critical for its function in autophagy-lysosomal pathway. (A) Left panel: Lysates of SNX10-Flag transfected HCT116 cells treated with or without EBSS for 3 h were subjected to immunoprecipitation analysis. Right panel: Lysates of Flag-tagged full-length SNX10 or its different truncated mutants transfected HCT116 cells were subjected to immunoprecipitation analysis. (B) HCT116 cells were co-transfected with Flag-tagged ATG5 and HA-tagged different lengths of SNX10. Whole cell lysates were subjected to immunoprecipitation analysis. (C) HCT116 cells were transfected with GFP-tagged full-length SNX10 or its different truncated mutants, followed by EBSS and/or CQ (50 μM) treatment for 3 h. Antibodies were used to detect endogenous ATG5 or LAMP1. Scale bar: 5 μm. (D) Cartoon model of ATG5-SNX10-LAMP1 complex. SNX10 dimer is pale cyan and shows two extending helices; the PXe domain is cyan; ATG5 is yellow; LAMP1 is magenta. Crucial amino acid numbers in ATG5-SNX10 and SNX10-LAMP1 complex were marked. Hydrogen bonds and salt bridges formed among these amino acids were depicted as red dash lines. A part of the crystal surface structure of ATG5-SNX10-LAMP1 complex was shown. (E) Pull-down assay of ATG12-ATG5 and LAMP1 by Flag-tagged WT SNX10 or its different point mutants. (F) HCT116 cells transfected with SNX10 point mutants (M152A or N153A or R155A) plasmids were treated with EBSS for 3 h, followed by immunoblotting analysis. (G) Proposed mechanisms for SNX10 in integrating autolysosomal formation and SRC targeted autophagic degradation to control SRC and downstream STAT3 and CTNNB1 signaling activation cascade.