Figures & data
Figure 1. The final optimized monolayer hiPSC mDAN differentiation protocol. (A) Schematic of the protocol. Refer to Materials and Methods for concentrations. Passaging steps are indicated with red lines. Detailed, stepwise methodology can be found in [Citation80]. (B, C) Confocal immunofluorescence imaging of day 35 neuronal cultures (NAS2 hiPSCs) generated using the final protocol. (B) Cultures labeled with anti-TUBB3 (TUJ1) and anti-TH antibodies and stained with Hoescht. (C) Cultures labeled with anti-FOXA2 and anti-TH antibodies and stained with Hoescht. (D) Quantitation of cell identity in day 35 neuronal cultures. Data show means ± SD for 3 independent terminal differentiations seeded from a single neuralization. Four fields per coverslip were analyzed. (E) Confocal immunofluorescence imaging of day 35 AST23 cultures. Bars: 50 μm
![Figure 1. The final optimized monolayer hiPSC mDAN differentiation protocol. (A) Schematic of the protocol. Refer to Materials and Methods for concentrations. Passaging steps are indicated with red lines. Detailed, stepwise methodology can be found in [Citation80]. (B, C) Confocal immunofluorescence imaging of day 35 neuronal cultures (NAS2 hiPSCs) generated using the final protocol. (B) Cultures labeled with anti-TUBB3 (TUJ1) and anti-TH antibodies and stained with Hoescht. (C) Cultures labeled with anti-FOXA2 and anti-TH antibodies and stained with Hoescht. (D) Quantitation of cell identity in day 35 neuronal cultures. Data show means ± SD for 3 independent terminal differentiations seeded from a single neuralization. Four fields per coverslip were analyzed. (E) Confocal immunofluorescence imaging of day 35 AST23 cultures. Bars: 50 μm](/cms/asset/d0efad74-b8be-4300-9a68-9f5fa5b25271/kaup_a_1739441_f0001_oc.jpg)
Figure 2. Optimizing SHH-C42II and CHIR99021 concentrations during neural induction for improved mDAN differentiation efficiency. Images (A) and quantification (B) of day 35 mDAN cultures (NAS2 hiPSCs) labeled with anti-TUBB3 (TUJ1) and anti-TH antibodies and counter-stained with Hoescht. 4 separate conditions were tested: (I) no SHH, no CHIR99021; (ii) 200 ng/ml SHH, 0.8 μM CHIR99021; (iii) 300 ng/ml SHH, 0.8 μM CHIR99021; (iv) 300 ng/ml SHH, 0.6 μM CHIR99021. Data show means ± SD for 3 independent terminal differentiations seeded from a single neuralization. Four fields per coverslip were analyzed. (C) Immunoblotting for TH expression in lysates of cells at differentiation day 30, generated using conditions (i), (ii) and (iv). * P < 0.05; ** P < 0.01; *** P < 0.001. Bars: 50 μm
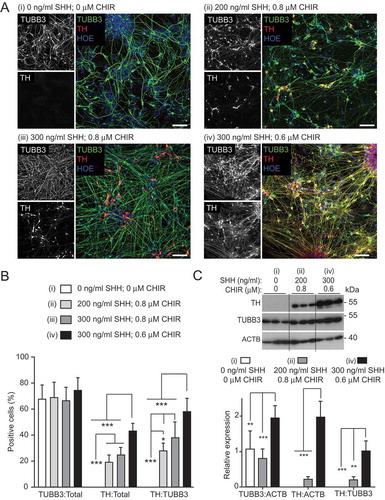
Figure 3. qRT-PCR expression profiling of pluripotency, midbrain, and dopaminergic markers during early differentiation under different SHH-C42II/CHIR99021 combinations in neuronal cultures enriched for mDANs. Differentiation was carried out using the optimized monolayer protocol, using NAS2 hiPSCs, with SHH-C42II/CHIR99021 ratios as follows: (I) no SHH-C42II, no CHIR99021; (ii) 200 ng/ml SHH-C42II, 0.8 μM CHIR99021; (iv) 300 ng/ml SHH-C42II, 0.6 μM CHIR99021. Results are from a single neuralization, and values are presented as means ± SEM of 3 terminal differentiations, fold-change versus hiPSCs. (A, B) Data are compared against hiPSC levels for these pluripotency markers, where: $$$ P < 0.001. (C-F) For these midbrain, floorplate and dopaminergic markers, data are compared within time-points and within treatments. Statistical comparisons against hiPSCs are not shown for clarity. ** P < 0.01; *** P < 0.001
Figure 4. qRT-PCR analysis of temporal changes in midbrain/floorplate and A9 dopaminergic maturity markers in neuronal cultures enriched for mDANs. NAS2 hiPSCs were differentiated according to the optimized monolayer protocol, using 300 ng/ml SHH-C42II, 0.6 μM CHIR99021. (A) Floorplate/midbrain marker FOXA2. (B-D) Dopaminergic markers, TH, DDC, and NR4A2. (E) The A9 dopaminergic maturity marker, KCNJ6. Results are from a single neuralization, and values are presented as means ± SEM of 3 terminal differentiations as fold-change from hiPSCs. ** P < 0.01; *** P < 0.001
Figure 5. qRT-PCR analysis of the temporal expression of autophagy genes as shown during mDAN differentiation in neuronal cultures enriched for mDANs. NAS2 hiPSCs were differentiated according to the optimized monolayer protocol, using 300 ng/ml SHH-C42II, 0.6 μM CHIR. Results are from a single neuralization, and values are presented as means ± SEM of 3 terminal differentiations as fold-change from hiPSCs. * P < 0.05; ** P < 0.01; *** P < 0.001
Figure 6. Examples of autophagy assessments in hiPSC-derived mDANs. In all cases, mDANs were differentiated from NAS2 hiPSCs using the optimized monolayer protocol. (A, B) Confocal imaging of day 60 neurons treated for 4 h with AZD8055, then stained for TH alongside (A) WIPI2 and (B) Cyto-ID. Example images to the left; quantitation to the right. (C) Day 47 neurons transduced with GFP-MAP1LC3B lentivirus and imaged up by time-lapse wide-field microscopy following the addition of AZD8055 (AZD; 4 h). Dynamic, GFP-MAP1LC3B-positive autophagic puncta can be observed within soma and neurites (arrows). (D) Day 25 neurons were transduced with lentivirus expressing GFP-ATG5, and imaged by time-lapse wide-field microscopy following the addition of AZD8055 (AZD; 4 h). GFP-ATG5 puncta (arrows) can be observed appearing, becoming brighter, then fading within the soma. (E) Representative immunoblots (left) for the indicated proteins from mDANs (differentiated at day 28–40) after 4 h treatment with AZD (1 μM) and/or BafA1 (20 nM), and densitometry quantitation (right). Arrow indicates LC3-II. Data are mean ± SEM (n = 2). Statistical analysis was performed using one-way ANOVA followed by a Tukey’s multiple comparisons test; P < 0.05; ** P < 0.01. Bars: 10 μm
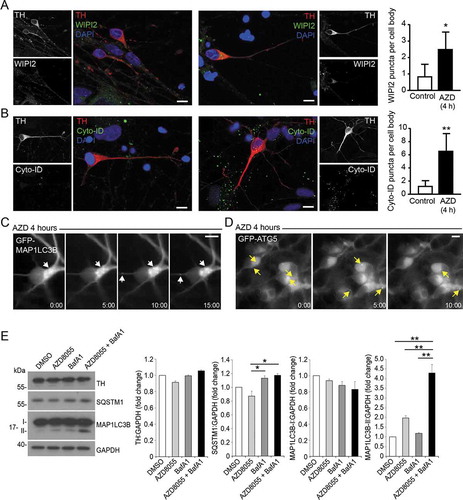
Figure 7. mDAN ultrastructure and growth cone dynamics. (A) Example EM images of untreated mDAN cultures: (I) shows a cell body (soma) region and neurite; (ii) shows a growth cone adjacent to neurites, with evidence of docked vesicular clusters; (iii) shows autophagosomal structures in a neurite. S = soma; N = neurite; GC = growth cone; AV = autophagic vacuole; V = vesicular cluster. (B) Example images and (C) quantitation (% cytoplasmic area occupancy) of autolysosomal profiles in the cell bodies of neurons present in mDAN cultures treated for 4 h with AZD8055 in the absence or presence of BafA1 (n = 12 cell bodies per condition). (D) Example frames from a live-cell imaging time-lapse sequence and (E) quantitation of axonal growth code extension rates in control or BafA1-treated mDAN cultures. Bar: 10 μm
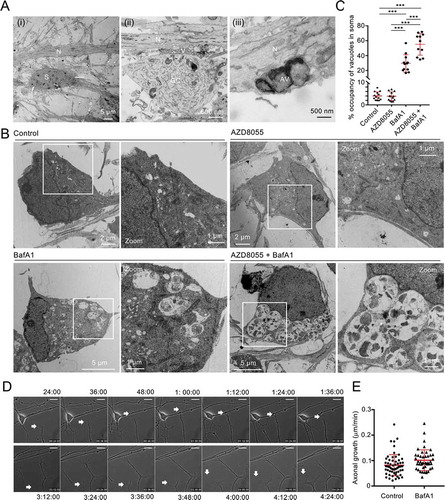
Figure 8. Characterization of mitochondrial properties in day 60 mDAN cultures differentiated from NAS2 hiPSCs using the optimized monolayer culture. (A) Imaging mitochondrial membrane potential collapse. Neurons were loaded with MT-R and MT-GR then imaged by wide-field fluorescence microscopy in the absence or presence of 10 μM CCCP. Data show means ± SD of 25 individual neurons from a single neuralization, verified by post-fix anti-TH labeling (not shown). (B) Measurements of mitochondrial membrane potential collapse in neuronal cultures by flow cytometry. mDAN cultures were transduced with lentiviruses expressing GFP from the SYN1 promoter, and individual GFP-expressing neurons loaded with MT-R were measured for mitochondrial membrane potential by flow cytometry. MT-R fluorescence was compared in control (DMSO) and CCCP-treated cells. (C, D) Seahorse Bioanalyzer measurements of OCR and ECAR in mDAN cultures grown for 1 d (C) and 3 d (D) in either glucose or galactose media. ** P < 0.01; *** P < 0.001
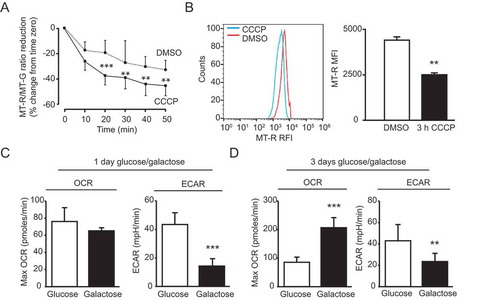
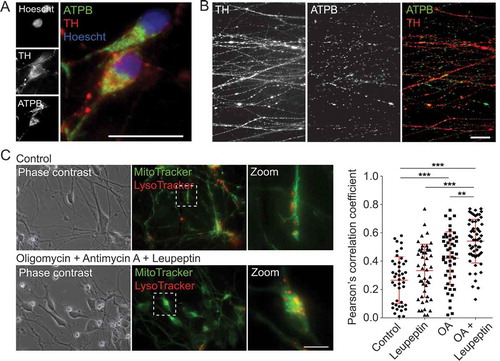
Figure 9. Examination of mitochondrial properties and quality control in mDANs differentiated from NAS2 hiPSCs. (A, B) Examples of neurons labeled with anti-TH and anti-ATPB (mitochondrial marker) antibodies. Cell bodies (A) and neurites (B) are shown. (C) Mitophagy analysis by colocalization of MT-G and LT-R in live mDAN cultures. To the left, example images of control and OA + Leupeptin treated neuronal fields are shown. To the right, data points show individual cells from 3 separate experiments. ** P < 0.01; *** P < 0.001. Bars: 10 μm