
Figures & data
Figure 1. Proteasomal inhibition induces the lysosomal degradation of AKT. (a) The effect of first-generation proteasome inhibitors (PIs) on AKT levels. Representative western blot analysis of myeloma cells (JJN3) incubated with 10 nM of the first-generation proteasome inhibitors, bortezomib, lactacystin, epoxomicin, or MG132 for 24 h. (b) Second-generation PIs downregulate AKT levels. Representative western blot analysis of cells incubated with second-generation PIs, carfilzomib (10 nM), ixazomib (40 nM), oprozomib (25 nM), and delanzomib (20 nM), for 24 h. (c) The temporal effects of bortezomib on AKT levels in JJN3 cells. Representative western blot analysis of JJN3 cells incubated with 10 nM bortezomib, for indicated times. (d) The effect of 10 nM bortezomib on AKT levels in primary cancer cells. Patient-derived, primary cancer cells were treated with 10 nM bortezomib for 24 h and evaluated by western blot analysis. (n = 4 independent experiments). Data are means ± SD. Asterisks indicate statistically significant differences (*P < 0.05). (e) Lysosome inhibition prevents PI-induced AKT degradation. Representative western blot analysis of OPM2 cells pretreated with the lysosome inhibitors, E-64 (35 μM), NH4Cl (25 mM), bafilomycin (200 nM), or chloroquine (50 μM), for 1 h, and then incubated with 10 nM bortezomib for 24 h. (f) Proteasome inhibition quickly affects lysosome activation in JJN3 cells. JJN3 cells were incubated with 10 nM bortezomib for the indicated times, and lysosomal activity was measured by FACS analysis. Data represent the mean ± SD of three independent experiments; *P < 0.05. (g) The effects of lysosome inhibition on PI-induced colocalization of LAMP1 and AKT by confocal microscopy. RPMI8226 cells were pretreated with 50 μM chloroquine for 1 h, and then incubated with 10 nM bortezomib for an additional 8 h. Cells were fixed and labeled with anti-LAMP1 (red) or anti-AKT (green) antibodies, and images were captured. Yellow = merge/colocalization. Larger white boxes in the images are enlargements of the area indicated by the smaller white boxes; scale bars: 10 μm. (h) Quantification of the colocalization of LAMP1 and AKT. Merged images from Figure 1(g) were analyzed for LAMP1:AKT colocalization using NIS Elements software and Pearson’s correlation coefficient. Data represent the mean ± SD of 10 randomly selected cells per condition; *P < 0.05. (i) PIs induce the accumulation of AKT aggregates in a PI dose-dependent manner. JJN3 cells were incubated with bortezomib at the indicated concentrations and for the indicated times prior to extracting the proteins and separating them into Triton X-100 soluble and insoluble fractions. Ubiquitin blot was used as an aggregated protein fraction control. (j) Lysosome inhibition prevents PI-induced AKT degradation in patient samples. Primary, patient-derived, multiple myeloma cells were pretreated with 50 μM chloroquine for 1 h, then incubated with 10 nM bortezomib for 12 h before p-AKT and AKT levels were assessed by western blot analysis. GAPDH was used as a loading control. Blots (described in Fig. S1L) were scanned, and protein levels were quantified. Data represent the mean ± SD of four independent experiments; *P < 0.05
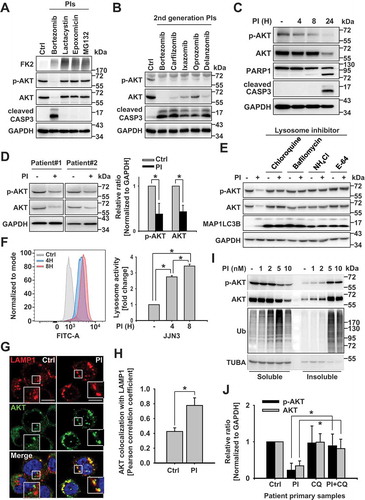
Figure 2. Autophagy plays a key role in the lysosomal degradation of AKT (a and c) Lysosome inhibition and proteasome inhibition induce the colocalization of AKT with SQSTM1 and with MAP1LC3B. RPMI 8226 cells were pretreated with the lysosome inhibitor NH4Cl (25 mM) for 1 h. The protease inhibitor (PI), bortezomib (10 nM), was then added, and the cells were incubated for an additional 8 h and fixed. They were then labeled with (a) antibodies to AKT (red) or MAP1LC3B (green), and (c) antibodies to AKT (red) or SQSTM1 (green), prior to capturing the images by confocal microscopy. Yellow = merge/colocalization. Larger white boxes in the images are enlargements of the area indicated by the smaller white boxes; scale bars: 10 μm. (b) Quantification of the colocalization of AKT and MAP1LC3B. Merged images from Figure 2(a) were analyzed for AKT:MAP1LC3B colocalization using NIS Elements software and Pearson’s correlation coefficient. Data represent the mean ± SD of 10 randomly selected cells per condition; *P < 0.05. (d) Quantification of the colocalization of AKT and SQSTM1. Merged images from Figure 2(c) were analyzed for AKT:SQSTM1 colocalization using NIS Elements software and Pearson’s correlation coefficient. Data represent the mean ± SD of 10 randomly selected cells per condition; *P < 0.05. (e and f) Autophagy inhibition prevents the effects of PIs on AKT degradation. (e) Representative western blot analysis of RPMI 8226 and OPM2 cells transfected with scrambled RNAs or siRNA specific to ATG5. After 24 h, 10 nM bortezomib was added, and the cells were incubated for an additional 24 h. GAPDH used as the loading control. (f) Representative western blot analysis of wild-type (WT) mouse embryonic fibroblasts (MEFs) and atg5-knockout (KO) MEFs incubated with 40 nM bortezomib for 24 h. (g) AKT interacts with MAP1LC3 when proteasomal and lysosomal degradation is inhibited. Then, 24 h post-transfection with an EGFP plasmid or an EGFP-MAP1LC3 expression plasmid, OPM2 cells were pretreated with 25 mM NH4Cl for 1 h. Bortezomib (10 nM) was then added, and the cells were incubated for an additional 8 h. The interaction between AKT and MAP1LC3 was assessed by immunoprecipitation with an anti-EGFP antibody. (h) OPM2 cells were transfected with a scrambled siRNA or with an SQSTM1-specific siRNA. After 24 h, the cells were incubated with 10 nM bortezomib, 10 nM carfilzomib, 40 nM ixazomib, or 10 nM marizomib
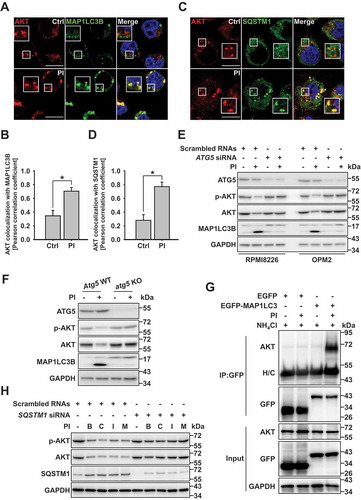
Figure 3. R-HSPA5 functions as a delivery determinant for AKT and SQSTM1 to autophagosomes. (a) Cycloheximide degradation assay of R-HSPA5, p-AKT, and AKT in atg5 KO mouse embryonic fibroblasts (MEFs) in the absence or presence of PI (bortezomib, 10 nM). Cells were treated with 50 μg/ml cycloheximide for different periods of time. Protein expression was assessed by western blot analysis. (b) R-HSPA5 is associated with the lysosomal degradation of AKT. JJN3 cells were treated with PI (bortezomib, 10 nM) for times indicated. Cells were pretreated with chloroquine (50 μM) for 1 h before PI treatment. Protein levels were evaluated by western blot analysis. (c) AKT1 interacts with R-HSPA5. JJN3 cells were transfected with AKT1-MYC-His. After 24 h post-transfection, cells treated with bafilomycin (100 nM) for 1 h and then, PI (bortezomib, 10 nM), and thapsigargin (200 nM) incubation for an additional 12 h. AKT1 and R-HSPA5 binding was evaluated by Ni-NTA His pull-down assay. (d) Scrambled or ATE1-knockdown JJN3 cells were treated with PI (bortezomib, 10 nM), followed by western blot. (e) FaDu cells were transfected with scrambled or ATE1-specific siRNA, followed by treatment for 12 h with PI (bortezomib, 40 nM). Colocalization analysis between R-HSPA5 (green) and AKT (red). Yellow = merge/colocalization. Larger white boxes in the images are enlargements of the area indicated by the smaller white boxes; scale bars: 10 μm. (f) Quantification of the colocalization of AKT and R-HSPA5 puncta. Merged images from Figure 3(e) were analyzed for AKT:R-HSPA5 colocalization using NIS Elements software and Pearson’s correlation coefficient. Data represent the mean ± SD of 10 randomly selected cells per condition; *P < 0.05, n.s. (not significant). (g) JJN3 cells were treated with PI (bortezomib, 10 nM) or co-treated with NAC (10 mM), followed by western blot. (h) Colocalization of cytoplasmic R-HSPA5 puncta with SQSTM1 in PI (bortezomib, 40 nM)-treated FaDu cells. (i) Colocalization of R-HSPA5 puncta with AKT in FaDu cells as determined by immunofluorescence, using anti-HSPA5 (green) and anti-AKT (red) antibodies. Yellow = merge/colocalization. Larger white boxes in the images are enlargements of the area indicated by the smaller white boxes; scale bars: 10 μm
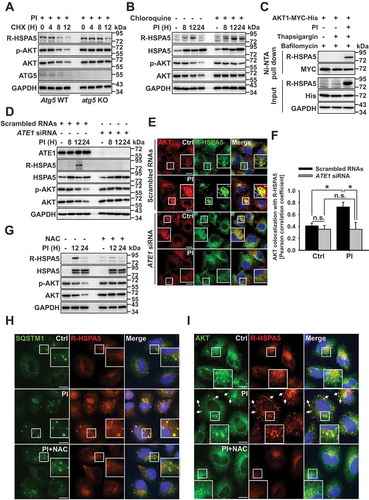
Figure 4. MUL1 controls AKT lysosomal degradation. (a) Proteasome inhibitors induce AKT ubiquitination in patient samples. Patient primary MM cells were pretreated with NH4Cl (25 mM) for 1 h, then PI (carfilzomib, 10 nM) for 8 h. Cells lysates were immunoprecipitated with anti-p-AKT, followed by western blot with the indicated antibodies. (b) Proteasome inhibition induces K48-linked ubiquitination of AKT1. JJN3 cells were transfected AKT1-MYC-His together with HA-Ub WT or ubiquitin mutants (HA-Ub K48 or HA-UbK48 R). After 24 h, cells were pretreated with NH4Cl (25 mM) for 1 h, prior to the addition of PI (bortezomib,10 nM) for 8 h. Ubiquitinated AKT1 was identified by Ni-NTA His pull-down ubiquitination assay. (c) MUL1 knockdown inhibits AKT1 ubiquitination under proteasome inhibition. After transfection with scrambled RNAs or MUL1 siRNA, AKT1-MYC-His, or HA-Ub, JJN3 cells were pretreated with NH4Cl (25 mM) for 1 h, prior to addition of PI (bortezomib, 10 nM) for 8 h. Ubiquitinated AKT1 was detected by His pull-down ubiquitination assay. (d) PI-induced AKT reduction is prevented in mul1 KO cells. MUL1 WT or mul1 KO cells [Citation17] were treated with PI (bortezomib, 10 nM) for 24 h. The cells were subjected to western blot. (e) Quantitative analysis of the MUL1 protein level described in Fig. S4I. Data represent the mean ± SD. Asterisks indicate statistically significant differences. (n = 4 independent experiments, *P < 0.05). (f) MUL1 overexpression induces cell growth inhibition. U266 or JJN3 cells were transfected with mock or pCMV6-MUL1. At 48 h after transfection, the cells were harvested for western blot. Cell growth was measured by the MTS assay on each indicated day (D1, 24 h after transfection; D2, 48 h after transfection). Data represent the mean ± SD. Asterisks indicate statistically significant differences (n = 6, *P < 0.05). (g) MUL1 WT or mul1 KO cells were pretreated with bafilomycin (100 nM) for 1 h, prior to the addition of PI (bortezomib, 10 nM) for 8 h and either fixed and labeled with anti-LAMP1 (red) and anti-SQSTM1 (green) antibodies. Yellow = merge/colocalization. Larger white boxes in the images are enlargements of the area indicated by the smaller white boxes; scale bars: 10 μm. (h) Quantification of the colocalization of SQSTM1 and LAMP1. Merged images from Figure 4(g) were analyzed for SQSTM1:LAMP1 colocalization using NIS Elements software and Pearson’s correlation coefficient. Data represent the mean ± SD of 10 randomly selected cells per condition; *P < 0.05, n.s. (not significant). (i) MUL1 WT or mul1 KO cells were treated with PI (bortezomib, 20 or 40 nM) for 24 h. Cells lysates were subjected to western blot with the indicated antibodies
![Figure 4. MUL1 controls AKT lysosomal degradation. (a) Proteasome inhibitors induce AKT ubiquitination in patient samples. Patient primary MM cells were pretreated with NH4Cl (25 mM) for 1 h, then PI (carfilzomib, 10 nM) for 8 h. Cells lysates were immunoprecipitated with anti-p-AKT, followed by western blot with the indicated antibodies. (b) Proteasome inhibition induces K48-linked ubiquitination of AKT1. JJN3 cells were transfected AKT1-MYC-His together with HA-Ub WT or ubiquitin mutants (HA-Ub K48 or HA-UbK48 R). After 24 h, cells were pretreated with NH4Cl (25 mM) for 1 h, prior to the addition of PI (bortezomib,10 nM) for 8 h. Ubiquitinated AKT1 was identified by Ni-NTA His pull-down ubiquitination assay. (c) MUL1 knockdown inhibits AKT1 ubiquitination under proteasome inhibition. After transfection with scrambled RNAs or MUL1 siRNA, AKT1-MYC-His, or HA-Ub, JJN3 cells were pretreated with NH4Cl (25 mM) for 1 h, prior to addition of PI (bortezomib, 10 nM) for 8 h. Ubiquitinated AKT1 was detected by His pull-down ubiquitination assay. (d) PI-induced AKT reduction is prevented in mul1 KO cells. MUL1 WT or mul1 KO cells [Citation17] were treated with PI (bortezomib, 10 nM) for 24 h. The cells were subjected to western blot. (e) Quantitative analysis of the MUL1 protein level described in Fig. S4I. Data represent the mean ± SD. Asterisks indicate statistically significant differences. (n = 4 independent experiments, *P < 0.05). (f) MUL1 overexpression induces cell growth inhibition. U266 or JJN3 cells were transfected with mock or pCMV6-MUL1. At 48 h after transfection, the cells were harvested for western blot. Cell growth was measured by the MTS assay on each indicated day (D1, 24 h after transfection; D2, 48 h after transfection). Data represent the mean ± SD. Asterisks indicate statistically significant differences (n = 6, *P < 0.05). (g) MUL1 WT or mul1 KO cells were pretreated with bafilomycin (100 nM) for 1 h, prior to the addition of PI (bortezomib, 10 nM) for 8 h and either fixed and labeled with anti-LAMP1 (red) and anti-SQSTM1 (green) antibodies. Yellow = merge/colocalization. Larger white boxes in the images are enlargements of the area indicated by the smaller white boxes; scale bars: 10 μm. (h) Quantification of the colocalization of SQSTM1 and LAMP1. Merged images from Figure 4(g) were analyzed for SQSTM1:LAMP1 colocalization using NIS Elements software and Pearson’s correlation coefficient. Data represent the mean ± SD of 10 randomly selected cells per condition; *P < 0.05, n.s. (not significant). (i) MUL1 WT or mul1 KO cells were treated with PI (bortezomib, 20 or 40 nM) for 24 h. Cells lysates were subjected to western blot with the indicated antibodies](/cms/asset/7f11ffde-4349-402d-a4ff-04435563068a/kaup_a_1740529_f0004_c.jpg)
Figure 5. USP7 prevents bortezomib-induced AKT ubiquitination and degradation. (a) OPM2 cells were co-transfected with AKT1-MYC-His, HA-Ub, or Flag-USP7. A pretreatment of chloroquine (50 μM) was given for 1 h before the bortezomib (10 nM) treatment for 12 h. Cells were lysed, and AKT1 protein was immunoprecipitated by His pull-down assay, and ubiquitination levels were analyzed using an anti-HA antibody by western blot. (b) OPM2 cells were transfected with mock or Flag-USP7. Then, 24 h later, cells were treated with bortezomib (10 nM) for 12 h, lysed, and the indicated proteins were determined by western blot. (c) USP7 interacts with p-AKT. OPM2 cells were lysed, and p-AKT was immunoprecipitated using an anti-p-AKT antibody. western blots were probed with anti-p-AKT and USP7 antibodies. (d) USP7 inhibits the colocalization of AKT with LAMP1. RPMI8226 cells were transfected with mock or Flag-USP7. After 24 h, cells were pretreated for 1 h with chloroquine (50 μM), prior to the addition of bortezomib (10 nM) for 8 h. Cells were fixed and labeled with anti-p-AKT and LAMP1 antibodies. Yellow = merge/colocalization. Larger white boxes in the images are enlargements of the area indicated by the smaller white boxes; scale bars: 10 μm. (e) Quantification of the colocalization of p-AKT and LAMP1. Merged images from Figure 5(d) were analyzed for p-AKT:LAMP1 colocalization using NIS Elements software and Pearson’s correlation coefficient. Data represent the mean ± SD of 10 randomly selected cells per condition; *P < 0.05, n.s. (not significant). (f) The autophagic targeting of ubiquitinated AKT and R-HSPA5 is impaired in USP7-overexpressed cells. OPM2 cells were transfected with mock or Flag-USP7 in a dose-dependent manner. After 24 h, cells treated with the presence of chloroquine (50 μM) for 1 h and were additionally treated with bortezomib (10 nM) or thapsigargin (200 nM) for a further 12 h. Proteins were subjected to immunoprecipitation with an anti-p-AKT antibody, followed by western blot with the indicated antibodies. (g) MUL1 overexpression induces G2/M cell cycle arrest in bortezomib-resistance MM cells. RPMI8226/BTZ cells were transfected with mock or pCMV6-MUL1 for 48 h, and cell cycle analysis was processed after 70% ethanol fixation and PI staining. (h) MUL1 overexpression suppresses cell growth in bortezomib-resistance MM cells. RPMI8226/BTZ were transfected with mock or pCMV6-MUL1. At 48 h after transfection, the cells were harvested for western blot. Inhibition of cell growth was measured by the MTS assay on each indicated day (D1, 24 h after transfection; D2, 48 h after transfection). Data represent the mean ± SD. Asterisks indicate statistically significant differences (n = 6, *P < 0.05)
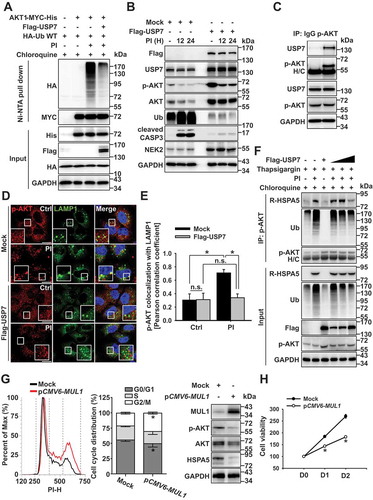
Figure 6. Sequential ubiquitination of residues K284 to K214 plays a vital role in AKT1 degradation. (a) AKT1 lysine (K) residues, K284 and K214, are putative protease inhibitor ubiquitination sites. Eleven lysine residues in the kinase domain of AKT1 were replaced with alanine (R) and each indicated plasmids were transfected into JJN3 cells. At 24 h after transfection, cells were pretreated with NH4Cl (25 mM) for 1 h, prior to the addition of PI (bortezomib, 10 nM) for 8 h. Ubiquitinated form of AKT1 was performed by Ni-NTA His pull-down ubiquitination assay. (b) RPMI8226 cells were transfected HA-Ub K48 together with AKT1 WT-MYC-His or AKT1 mutants (AKT1K214 R-MYC-His or AKT1K284 R-MYC-His). After 24 h, cells were treated with NH4Cl (25 mM) for 1 h, and then, PI (bortezomib, 10 nM) was treated for an additional 8 h. White box in merge pictures showed the colocalization of K48 ubiquitin-positive inclusions with AKT1 WT-MYC-His (but not AKT1K214 R-MYC-His or AKT1K284 R-MYC-His). Yellow = merge/colocalization. Larger white boxes in the images are enlargements of the area indicated by the smaller white boxes; scale bars: 10 μm. (c) K284/K214 mutant is sensitively degraded compared with AKT1 WT under proteasome inhibition. JJN3 cells were transfected with AKT1 WT-MYC-His, AKT1 K214-MYC-His, AKT1 K284-MYC-His, or AKT1 K284/K214-MYC-His. At 24 h after transfection, cells were treated with PI (bortezomib, 10 nM) for the indicated times, and p-AKT1 (S473), p-AKT1 (T308), p-GSK3B, GSK3B or GAPDH levels were determined by western blot. (* or ** means exo- or endogenous p-AKT1). (d) Under proteasome inhibitory status, MUL1 is finally attachment of K48 ubiquitin linkages to the K214 of AKT1. JJN3 cells were co-transfected with the EGFP-MUL1 together with the AKT1 K214-MYC-His, AKT1 K284-MYC-His or AKT1 K284/K214-MYC-His. After 30 h, cells were treated with chloroquine (50 μM) for 1 h, prior to the addition of PI (bortezomib, 10 nM) for the indicated times. Ubiquitinated AKT1 was identified by Ni-NTA His pull-down ubiquitination assay. (e) Fully ubiquitinated AKT1 (in which both K284 and K214 residues are ubiquitinated) can bind to R-HSPA5. JJN3 cells were transfected with AKT1 K214-MYC-His, AKT1 K284-MYC-His, or AKT1 K284/K214-MYC-His plasmids. Then, 24 h later, cells were pretreated with 25 mM NH4Cl 25 mM for 1 h prior to incubating the cells for 12 h with 200 nM thapsigargin, with or without 10 nM bortezomib (PI). AKT1-R-HSPA5 binding was evaluated by Ni-NTA His pull-down assay. (f) Silencing of MUL1 avoids PI-mediated K284/K214 AKT1 degradation. After transfection with scrambled RNAs or MUL1 siRNA, AKT1 K214-MYC-His, AKT1 K284-MYC-His, or AKT1 K284/K214-MYC-His, JJN3 cells were treated with PI (bortezomib, 10 nM) for 12 h. The indicated protein levels were determined by western blot. (g) MUL1 WT or mul1 KO cells were transfected with AKT1 K214-MYC-His, AKT1 K284-MYC-His, or AKT1 K284/K214-MYC-His. After 24 h, cells were treated with PI (bortezomib, 10 nM) for 24 h. The cells were subjected to western blot. (h) The cell growth of AKT1K284 R,K214 R-expressing cells is less affected by PI. JJN3 cells were transfected with mock, AKT1 WT-MYC-His, or AKT1K284 R,K214 R-MYC-His. At 24 h after transfection, cells were treated with PI (bortezomib, 10 nM) for 24 h. Cell viability was assessed by the MTS assay. Data represent the mean ± SD. Asterisks indicate statistically significant differences (n = 6, P < 0.05)
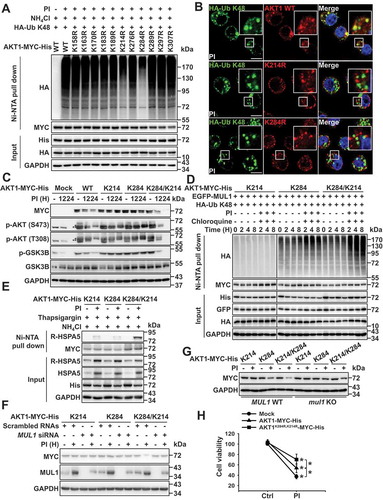
Figure 7. Novel proteolysis mechanisms of AKT through crosstalk between R-HSPA5 and a sequentially ubiquitinated form of AKT. Unfolded and/or misfolded proteins are targeted by ubiquitin for degradation by the proteasome or lysosome pathways. The proteasome inhibitor leads to the accumulation of excessive misfolded/ubiquitinated protein aggregates. Proteasome inhibition facilitates the formation of ubiquitinated proteins, induced R-HSPA5 [Citation21] or MUL1 (steps 1 and 2). In various oxidative conditions, MUL1 induces AKT degradation by UPS via K48-linked ubiquitination at K284 residue [Citation15] (step 3). However, AKT could not induce degradation because proteasome is inhibited by PI, therefore, ubiquitinated AKT is able to lysosomal degradation, for ubiquitin chains linked to another lysine (K214) of AKT by MUL1, generating unique coding signatures of the K48 linkages. (step 4). Sequential ubiquitination of AKT from K284 to K214 acts as a substrate-specific mark for lysosomal degradation through autophagosome. The resulting fully ubiquitinated form of AKT at both K284 and K214 could bind with R-HAPS5 (step 5). This enables selective recruitment of cargo along with R-HSPA5, SQSTAM1, and MAP1LC3 on the autophagic membranes [Citation21,Citation37] (step 6). Following vesicle closure, the autophagosome fuses (step 7) with the lysosome whereby the engulfed material is degraded (step 8). In this model, the connection between MUL1-mediated sequential ubiquitination of AKT and arginylation of HSPA5 is essential for the lysosomal degradation of AKT under proteasome inhibitory cellular stress
![Figure 7. Novel proteolysis mechanisms of AKT through crosstalk between R-HSPA5 and a sequentially ubiquitinated form of AKT. Unfolded and/or misfolded proteins are targeted by ubiquitin for degradation by the proteasome or lysosome pathways. The proteasome inhibitor leads to the accumulation of excessive misfolded/ubiquitinated protein aggregates. Proteasome inhibition facilitates the formation of ubiquitinated proteins, induced R-HSPA5 [Citation21] or MUL1 (steps 1 and 2). In various oxidative conditions, MUL1 induces AKT degradation by UPS via K48-linked ubiquitination at K284 residue [Citation15] (step 3). However, AKT could not induce degradation because proteasome is inhibited by PI, therefore, ubiquitinated AKT is able to lysosomal degradation, for ubiquitin chains linked to another lysine (K214) of AKT by MUL1, generating unique coding signatures of the K48 linkages. (step 4). Sequential ubiquitination of AKT from K284 to K214 acts as a substrate-specific mark for lysosomal degradation through autophagosome. The resulting fully ubiquitinated form of AKT at both K284 and K214 could bind with R-HAPS5 (step 5). This enables selective recruitment of cargo along with R-HSPA5, SQSTAM1, and MAP1LC3 on the autophagic membranes [Citation21,Citation37] (step 6). Following vesicle closure, the autophagosome fuses (step 7) with the lysosome whereby the engulfed material is degraded (step 8). In this model, the connection between MUL1-mediated sequential ubiquitination of AKT and arginylation of HSPA5 is essential for the lysosomal degradation of AKT under proteasome inhibitory cellular stress](/cms/asset/8fd97d22-aa4c-47b0-abb0-6f1fdd7ec2ea/kaup_a_1740529_f0007_c.jpg)