Figures & data
Table 1. Characteristics of participants
Figure 1. Atorvastatin and the P2RY12 receptor inhibitor CDL may exert a synergistic anti-atherosclerotic effect. (A) Representative carotid ultrasound images of patients treated with ATV or ATV + CDL; images were obtained upon enrollment (baseline) and 6 months after treatment initiation (6 M). The red line indicates the MCPT. Graphs show MCPT (mm and %) was lower in patients after 6 months of treatment than at enrollment (n = 37 for ATV treatment and n = 37 for ATV + CDL treatment). (B) Schematic representation illustrating that apoe-/- mice were given an HFD for 8 weeks to induce atherosclerotic lesions and maintained on an HFD for another 4 weeks during which the vehicle control (ctrl), ATV or ATV + CDL was administered daily. (C) Images of ORO staining showing en face total aortas obtained from mice in the indicated groups. Scale bar: 2 mm. White arrows indicate plaques in the aorta. The percent of the en face aortic arch area that was occupied by the ORO-positive area was assessed (n = 10, 14, and 14, respectively). (D) Serum LDL-c levels in mice in the ctrl, ATV, and ATV + CDL groups (n = 10, 14, and 14, respectively). (E) apoe-/- mice were given an HFD for 8 weeks to induce baseline atherosclerotic lesions. Then, the mice were changed to a normal chow diet (CD) or maintained on an HFD for another 4 weeks, and during this time, CDL or ctrl was administered daily. Images of ORO staining showing en face total aortas obtained from mice in the indicated groups. Scale bar: 2 mm. White arrows indicate plaques in the aorta. The percent en face aortic arch area that was occupied by the ORO-positive area was assessed (n = 19, 16, 18, and 18, respectively). (F) Serum LDL-c levels of mice from the CD + ctrl, CD + CDL, HFD + ctrl and HFD + CDL groups (n = 17, 16, 18 and 18, respectively). All data are shown as the mean ± SEM. *, P < 0.05; **, P < 0.01; ***, P < 0.001
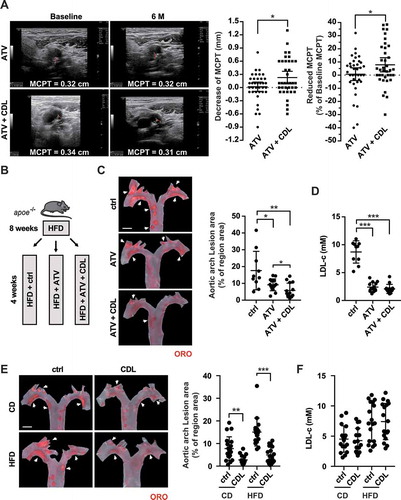
Figure 2. The P2RY12 receptor inhibitor ameliorates lipid accumulation and VSMC-derived foam cell formation in advanced atherosclerosis. (A) Representative images of aortic root sections obtained from mice in the CD + ctrl, CD + CDL, HFD + ctrl and HFD + CDL groups. For HE, (ii) Enlargement of the insert shown in (I) with the necrotic core marked by a yellow line. Scale bars: 40 μm (upper), 15 μm (bottom). For ORO, Scale bar: 40 μm. The plaque area (B) and percentage of the plaque area that was occupied by the necrotic core (C) and ORO (D) are presented (n = 19, 16, 18, and 18, respectively). (E) Fluorescence images of ACTA2-BODIPY or PDGFRB-BODIPY in aortic root sections obtained from mice in the CD + ctrl, CD + CDL, HFD + ctrl and HFD + CDL groups. Nuclei were stained with DAPI (blue). Scale bar: 20 μm. White dashed lines indicate VSMC-derived foam cells. The percentage of the plaque area that was occupied by BODIPY (F) are presented (n = 19, 16, 18, and 18, respectively) among indicated groups. The number of ACTA2+ BODIPY+ cells (G) or PDGFRB+ BODIPY+ cells (H) per mm2 of plaques in the indicated groups is presented (n = 10 per group). All data are shown as the mean ± SEM from 3 to 5 independent experiments. *, P < 0.05; **, P < 0.01; ***, P < 0.001
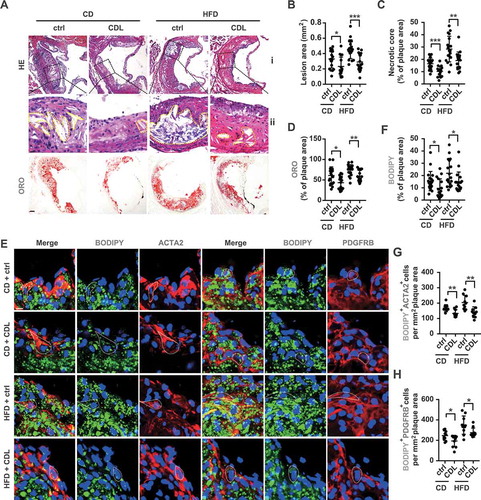
Figure 3. The P2RY12 receptor promotes VSMC-derived foam cells by inhibiting cholesterol efflux. (A) Confocal images (upper) or optical images (bellow) of VSMCs labeled by BODIPY or ORO. Ox-LDL-stimulated VSMCs were treated with vehicle control, a P2RY12 receptor activator (ADPβs), a P2RY12 receptor inhibitor (2-MeSAMP), or a combination of the two and then imaged 24 h post-stimulation. The average body (left) or ORO (right) area per cell was assessed. Scale bar: 10 μm. (B) Total cholesterol levels in VSMCs were determined as described in A. (C) WB and PCR analysis of VSMCs transfected with a lentivirus containing the control vector (shctrl) or the P2RY12 receptor shRNA (shP2ry12). (D) ORO images of ox-LDL-loaded VSMCs in the indicated group. The graph shows the area positive for ORO per cell. The scale: 10 μm. (E) Total cholesterol levels in VSMCs were quantified as described in D. (F) Representative fluorescence images of VSMCs obtained in the indicated group and labeled with DIL-oxLDL at 37°C for 4 h. Cells were rinsed and incubated in complete medium without Dil-oxLDL. Scale bar: 10 μm. (G) Representative flow cytometry histogram of DIL-oxLDL-processed VSMCs obtained in the indicated group. Experiments were analyzed by flow cytometry to determine the mean DIL-oxLDL burden (mFI). (H) Representative fluorescent images of the NBD-cholesterol burden in VSMCs obtained in the indicated group after incubation with HDL or APOA1 for 4 h. The HDL and APOA1-mediated cholesterol efflux (%) were analyzed in these groups. Scale bar: 10 μm. (I) HDL- and APOA1-mediated cholesterol efflux (%) was measured in shctrl-infected or shP2ry12-infected VSMCs stimulated with ADPβs or vehicle control. All data are presented as the mean ± SEM from 3 to 5 independent experiments. *, P < 0.05; **, P < 0.01; ***, P < 0.001
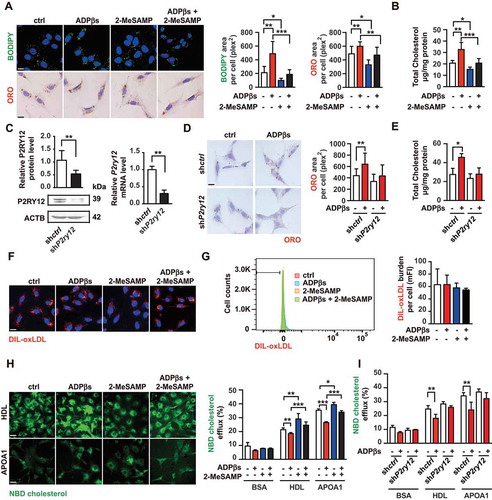
Figure 4. The P2RY12 receptor inhibits cholesterol efflux through the PI3K-AKT signaling pathway. (A) Representative images of BODIPY-positive area in VSMCs obtained from the indicated group. Nuclei were stained with DAPI (blue). Scale bar: 20 μm. Ox-LDL-stimulated VSMCs were cultured with LY294002 (50 µM), MK-2206 2HCl (MK2206, 5 µM), dbcAMP (0.02 mM) or 8-CPT-cAMP (0.02 mM) for 30 min, and then ADPβs or vehicle control was added for 24 h before the cells were analyzed to determine the size of the BODIPY-positive area. (B) Total cholesterol levels were measured in VSMCs as described in A. (C) HDL- and APOA1-mediated cholesterol efflux (%) was measured in VSMCs in the indicated groups. (D) Western blot for PIK3R1 and AKT1 phosphorylation in VSMCs treated with or without ADPβs or 2-MeSAMP. Representative western blots (left) and normalized ratios of p-PIK3R1:PIK3R1 or p-AKT1:AKT1 (right). (E) Western blot for PIK3R1 and AKT1 phosphorylation in shctrl-treated VSMCs and shP2ry12-treated VSMCs. Cells were treated with ADPβs or vehicle control for 24 h. Representative western blots (left) and normalized ratios of p-PIK3R1:PIK3R1 or p-AKT1:AKT1 (right). All data are presented as the mean ± SEM from 3 to 5 independent experiments. *, P < 0.05; **, P < 0.01; ***, P < 0.001
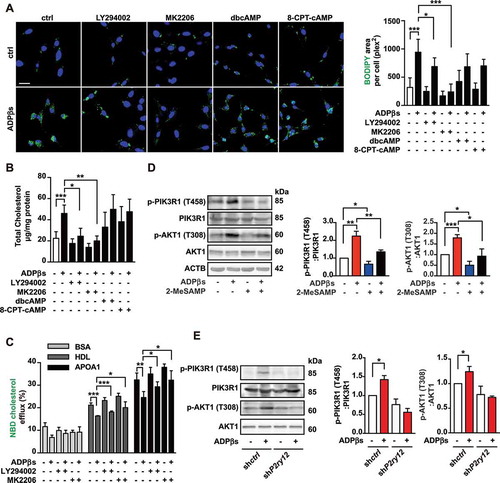
Figure 5. The P2RY12 receptor inhibits the autophagy-lysosome pathway in VSMCs. (A) Immunofluorescence for LysoTracker Red (red)-BODIPY (green) in VSMCs treated with or without ADPβs or 2-MeSAMP at the indicated time points. Hoechst 33342 was used to visualize nuclei (blue). Scale bar: 5 μm. (B) Percent colocalization between LysoTracker Red and BODIPY (white arrows in A) and the mean ± SEM of 20 different cells in each experiment. (C) Representative images of LC3 staining in VSMCs of indicated groups. DAPI was used to visualize nuclei (blue). Scale bars: 5 μm (top). Cells were pretreated with or without 50 μmol/L CQ for 2 h and then cultured with ADPβs or 2-MeSAMP. The number of LC3 (green) dots (D) is presented. The data are shown as the mean ± SEM for 20 different cells in each experiment. (E) Immunoblots for LC3 from VSMCs are shown for the indicated group. Graphs for LC3B-II relative to the control are presented above the band, relative net LC3B-II flux in groups as described in the right. (F) Immunoblots are shown for LC3B in shctrl-VSMCs or shP2ry12-VSMCs cultured with or without ADPβs. The graph above the band represents the densitometric value obtained for LC3B-II. Relative net LC3B-II flux in groups as described in the right. (G) Immunoblots for SQSTM1 in VSMCs in the indicated group. VSMCs were stimulated with vehicle control, ADPβs, 2-MeSAMP or a combination of the two. Cell lysates were separated into detergent (0.5% TX-100)-soluble and insoluble fractions. (H) Quantitative real-time PCR analysis of the mRNA levels of Lc3b and Sqstm1 in VSMCs treated with vehicle control, ADPβs, 2-MeSAMP, or their combination. Data are normalized to Actb expression. (I) Immunofluorescence images (left) for VSMCs transfected with ad-mRFP-GFP-Lc3 and then treated with vehicle control, ADPβs, 2-MeSAMP, or their combination. DAPI was used to visualize nuclei (blue). Scale bar: 10 μm. Quantitative data in the right represent the number of autophagosomes (yellow) dots and autolysosome (red) dots (n > 20 cells of each slide). All data are presented as the mean ± SEM from 3 to 5 independent experiments. For A-H, *, P < 0.05; **, P < 0.01; ***, P < 0.001. For I, ***, P < 0.001 compared with control group; ##, P < 0.01 compared with ADPβs group; ###, P < 0.001 compared with ADPβs group
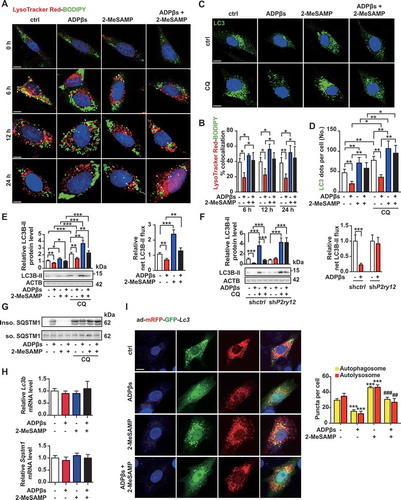
Figure 6. The P2RY12 receptor decreases cholesterol lipolysis and promotes VSMC foam cell formation by inhibiting autophagy. (A) Confocal images of LC3 (red)-BODIPY (green) in VSMCs of indicated groups. Enlargement of the insert show colocalized pixels in white (below). VSMCs were treated with vehicle control, ADPβs, 2-MeSAMP, CQ (50 μmol/L), which VSMCs in each group were pretreated 50 μg/mL ox-LDL. CQ was pre-added for 2 h. Rapamycin and torin-1 were used as positive controls. DAPI was used to visualize nuclei (blue). Scale bar: 10 μm. The percent colocalization between LC3 and BODIPY is presented (B). (C) Electron micrographs of VSMCs submitted to the indicated treatments for 4 or 24 h. LDs (asterisks); APGs, autophagosomes, initial autophagic vacuoles (AVs) (yellow arrowheads); AUTs, autolysosomes, late or degradative AVs (red arrowheads); and double-membrane structures (black arrowheads). scale bar: 1 μm. The average number and LDs area per cell section were also determined in images of TEM (D). Morphometric analysis was used to calculate the average number of total AVs per cell section (E). The number of APGs or AUTs per cell section was also assessed (F). The BODIPY-positive area (G), total cholesteryl content (H), and HDL- and APOA1-mediated cholesterol efflux (I) measured in VSMCs transfected with a control siRNA (sictrl) or an Atg5 siRNA (siAtg5) are presented. Cells were treated with vehicle control, ADPβs, 2-MeSAMP, or a combination of these factors. All data are presented as the mean ± SEM of 3 to 5 independent experiments. *, P < 0.05; **, P < 0.01; ***, P < 0.001 vs control or indicated group; #, P < 0.05 vs ADPβs group; ##, P < 0.01 vs ADPβs group
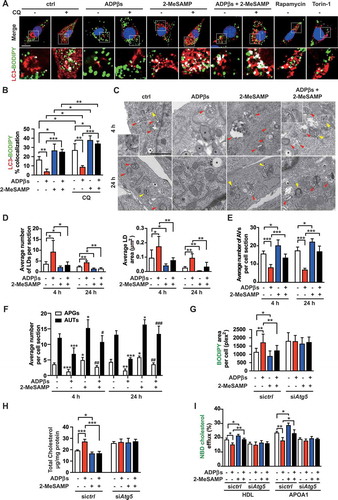
Figure 7. The P2RY12 receptor inhibits autophagy via the PI3K-AKT-MTOR pathway. (A) Activation of the AUTOPHAGY-ANIMAL signaling pathway in VSMCs treated with ADPβs. Phosphorylation levels are shown for each protein in the pathway relative to that observed in the control cells and indicated by a color scale of red (increased) to green (decreased). Proteins with no phosphorylation data are colored in white. (B) Representative western blots (left) and the normalized ratios of p-BECN1/beclin-1:BECN1/beclin-1, p-PRKAA:PRKAA, p-MTOR:MTOR, p-EIF4EBP1:EIF4EBP1, p-ULK1:ULK1 (right and below) in VSMCs treated with vehicle control, ADPβs, 2-MeSAMP, or a combination of these factors. (C) Representative western blots (left) and normalized ratios of p-MTOR:MTOR, p-EIF4EBP1:EIF4EBP1, p-ULK1:ULK1 (right) in shctrl-treated VSMCs or shP2ry12-treated VSMCs that were also treated with ADPβs or vehicle control. (D) Representative western blots (left) and normalized ratios of p-MTOR:MTOR, p-EIF4EBP1:EIF4EBP1, p-ULK1:ULK1 (right) in VSMCs treated with vehicle control, ADPβs, MK2206 (an AKT inhibitor), or a combination of these factors. The BODIPY-positive area, total cholesteryl content, and HDL and APOA1-mediated cholesterol efflux (%) were measured in VSMCs treated with rapamycin (E-G) or transfected with siRNA for MTOR (siMtor) (H-J) and are presented here. All data are presented as the mean ± SEM from 3 to 5 independent experiments. *, P < 0.05; **, P < 0.01; ***, P < 0.001
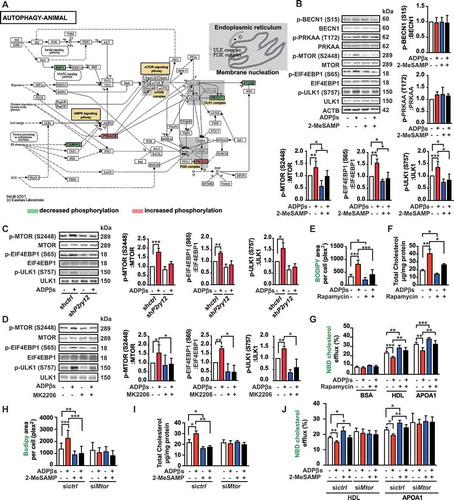
Figure 8. The P2RY12 receptor inhibitor induces autophagy in advanced atherosclerosis. (A) Immunoblot analysis of the expression of LC3B and SQSTM1 in extracts from the aortas of mice in the indicated group. apoe-/- mice were given HFD for 8 weeks to induce atherosclerotic lesions and maintained on a HFD for another 4 weeks, during which ctrl, CDL or CQ (50 μmol/L) was administered. Quantitative data represent the fold-change observed after normalizing the indicated protein band intensities relative to ACTB. LC3B-II flux is calculated in the middle. (B) Quantitative real-time PCR analysis of the mRNA levels of Lc3b and Sqstm1 in extracts from the aortas of mice in ctrl, CDL, CQ, or CQ + CDL group. Data are normalized to Actb expression. (C) apoe-/- mice were given HFD for 8 weeks to induce atherosclerotic lesions and maintained on a HFD for another 4 weeks, during which ctrl, CDL or CQ was administered. ACTA2 (green)-LC3 (red) and ACTA2 (green)-SQSTM1 (red) in aortic root sections of these groups were then estimated. Nuclei are shown in blue. Scale bar: 50 μm. The number of ACTA2+ LC3+ cells (D) or ACTA2+ SQSTM1+ cells (E) per mm2 of plaques in the indicated groups is presented (n = 9 per group). (F) Representative western blots (left) of extracts obtained from the aortas of mice among the indicated groups and normalized ratios of p-MTOR:MTOR, p-ULK1:ULK1, p-PIK3R1:PIK3R1, p-AKT1:AKT1, and p-EIF4EBP1:EIF4EBP1 and fold-change differences in P2RY12 after normalizing the indicated protein band intensities to that of ACTB. All data are presented as the mean ± SEM of 3 to 5 independent experiments. *, P < 0.05; **, P < 0.01; ***, P < 0.001
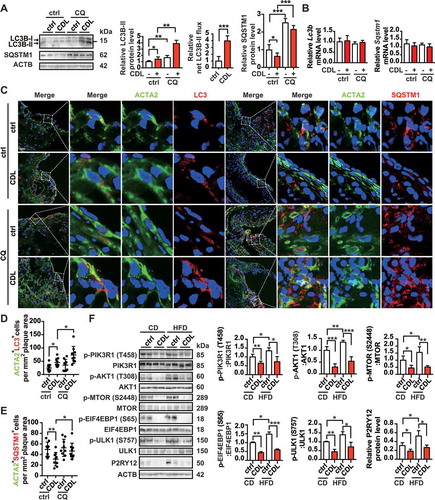
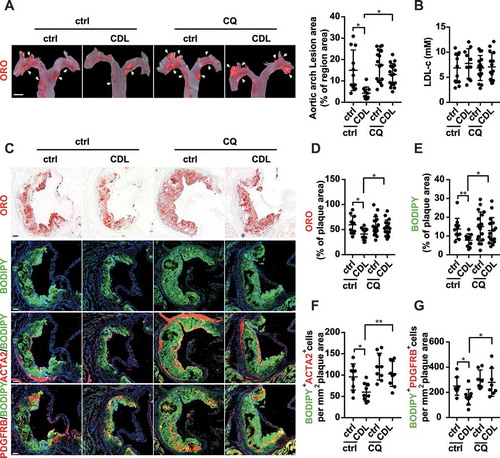
Figure 9. The P2RY12 receptor inhibitor ameliorates VSMC-derived foam cell formation by inducing autophagy in advanced atherosclerosis. apoe-/- mice were given HFD for 8 weeks to induce atherosclerotic lesions and maintained on HFD for another 4 weeks, during which ctrl, CDL or CQ was administered. (A) ORO image of aortic arches obtained from mice in the indicated groups (left). Scale bar: 2 mm. White arrows indicate plaques in the aorta. Lesions were calculated as a percentage of the surface area of the aortic arch (n = 11, 10, 16, and 17, respectively). (B) Serum LDL-c levels in mice in the ctrl, CDL, CQ, or CQ + CDL groups (n = 11, 10, 15, and 15, respectively). (C) Representative images of aortic root sections obtained from ctrl, CDL, CQ, and CQ + CDL groups stained with ORO, ACTA2-BODIPY, or PDGFRB-BODIPY. Scale bar: 20 μm. For fluorescence images, Nuclei were stained with DAPI (blue). The percentage of the plaque area that was occupied by ORO (D) or BODIPY (E) are presented (n = 11, 10, 18, and 17, respectively) among indicated groups. The number of ACTA2+ BODIPY+ cells (F, n = 9 per group) or PDGFRB+ BODIPY+ cells (G, n = 8, 9, 7 and 8, respectively) per mm2 of plaques in the indicated groups is presented. All data are presented as the mean ± SEM from 3 to 5 independent experiments. *, P < 0.05; **, P < 0.01