
Figures & data
Figure 1. Screen and identification of lycorine as an inhibitor of SCAP. (A) A scheme for in vitro screening of small molecules that bind SCAP. (B) Screening results of compounds targeting SCAP. Each compound (10 μM) was used for screening, as described in Figure 1A (n = 4). (C) The chemical structure of lycorine. (D) Dose- and temperature-dependent CETSA were performed to verify the interaction of lycorine with SCAP (n = 3). (E) The interaction between SCAP and lycorine or cholesterol was detected by MST. Lycorine is dissolved in DMSO and cholesterol is dissolved in ethanol (n = 3). (F) The binding energy of small molecules with SCAP. Error bars are represented as mean ± SEM. Statistical analysis was done with one-way ANOVA (Dunnett’s posttest). *p < 0.05, **p < 0.01, ***p < 0.001 vs control
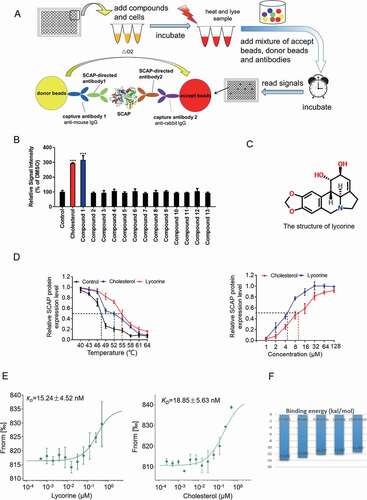
Figure 2. Lycorine inhibits the SREBF activity and decreases the cellular lipids without inducing ER stress and NR1H3 transactivation. (A) Lycorine downregulates SREBF activity. HL-7702/SRE-Luc cells were depleted of incubating in medium D for 16 h. The cells then were treated with different compounds as indicated. After incubation of another 16 h, cells were lysed with reporter lysis buffer and luciferase activity was measured (n = 4). (B) HL-7702 cells were treated with increasing concentrations of lycorine for 24 h, and cell viability was detected by MTT (n = 6). (C-F) HL-7702 cells were treated with cholesterol (20 μM) or lycorine (10, 20 μM) for 12 h (C and E), or lycorine (20 μM) for increasing time (D and F), whole-cell extracts underwent western blotting (WB) with indicated antibodies (left). Statistical analysis of expression of each protein was adjusted to ACTB (right) (n = 3). pSREBF1 or pSREBF2 represents precursor SREBF1 or precursor SREBF2; mSREBF1 or mSREBF2 represents mature SREBF1 or mature SREBF2. (G) HL-7702 cells were treated with 10 or 20 µM lycorine for 12 h, RNAs were extracted from these cells. The expression of various genes was analyzed by qRT-PCR (n = 3). (H) The cellular TG and TC contents were measured in HL-7702 hepatocytes treated with lycorine (5, 10 and 20 µM) for 16 h (n = 3). (I) HL-7702 cells were treated with indicated concentrations of lycorine for 16 h. 1–14 C-labeled acetic acid sodium salt was directly added into the medium and incubated for an additional 2 h. The fatty acid and total cholesterol were extracted and resolved by thin-layer chromatography. Radioactive products were visualized by phosphoimager and densitometric quantification is shown accordingly (n = 3). (J) The treated HL-7702 cells were fixed and stained with Filipin or Nile-Red. Quantification of the cellular cholesterol or neutral lipids was analyzed by image-pro plus (n = 3). (K) HL-7702 cells were treated with lycorine or sterol for 16 h, then RNAs were extracted. The expression of ER stress-related genes was analyzed by qRT-PCR (n = 3). (L) HL-7702 cells transfected with NR1H3 reporter and beta-gal plasmid were incubated with lycorine or sterol for 16 h, luciferase activity was then measured and normalized by the value of beta-gal (n = 6). (M) HL-7702 cells were treated with lycorine or sterol for 16 h, RNAs were extracted. The expression of NR1H3 target genes were analyzed by qRT-PCR (n = 3). Error bars are represented as mean ± SEM. Statistical analysis was done with one-way ANOVA (Dunnett’s posttest). *p < 0.05, **p < 0.01, ***p < 0.001 vs control
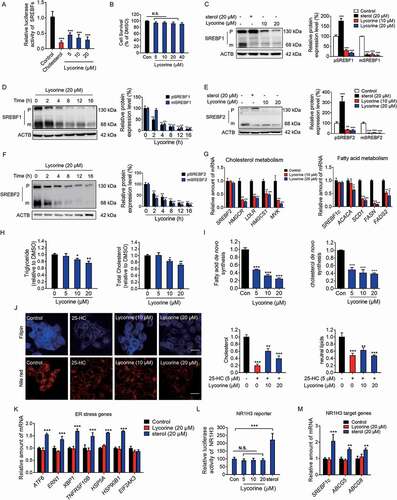
Figure 3. Lycorine decreases SCAP protein. (A) HL-7702 cells were treated with indicated compounds for 8 h, whole-cell extracts underwent WB with indicated antibodies. Statistical analysis of the expression of each protein was adjusted to ACTB (n = 3). (B) HL-7702 cells were pretreated with 10 μM sterol for 1 h, afterward, the cells were supplemented with 20 µM lycorine for 8 h, SCAP was detected by WB. Expression of each protein was adjusted to ACTB. Statistical analysis is on the right side (n = 3). (C-D) HL-7702 cells were treated with lycorine of indicated concentrations for 16 h (C), or lycorine (10 μM) with increasing time (D), whole-cell extracts underwent WB with indicated antibodies. Expression of each protein was adjusted to ACTB. Statistical analysis is on the right side (n = 3). (E) HL-7702 cells were transfected with MYC-SCAP plasmid for 24 h. The cells were incubated in medium D for 16 h and switched to medium D containing lycorine for 8 h. Then, the whole-cell extracts underwent WB with indicated antibodies (n = 3). (F) The wildtype or SCAP KO HL-7702 cells were incubated in medium D for 16 h and switched to medium D containing lycorine for 8 h, the whole-cell extracts underwent WB with indicated antibodies (n = 3). (G and H) SCAP KO HL-7702 cells (G) or SCAP KO HL-7702 cells transfected with MYC-SCAP (H) were treated with lycorine or sterol for 16 h, RNAs were extracted. The expression of ER stress-related genes was analyzed by qRT-PCR (n = 3). Error bars are represented as mean ± SEM. Statistical analysis was done with one-way ANOVA (Dunnett’s posttest). *p < 0.05, **p < 0.01, ***p < 0.001
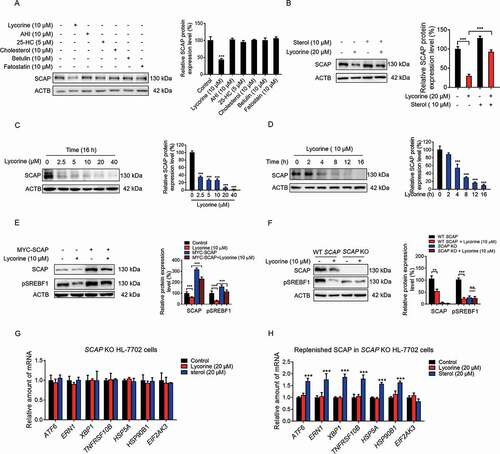
Figure 4. Lycorine accelerates SCAP degradation in an autophagy-independent manner. (A) HL-7702 cells were treated with lycorine for indicated dose and time. The SCAP mRNA level was analyzed by qRT-PCR (n = 3). (B) HL-7702 cells were incubated with 50 µM cycloheximide for 1 h, afterward, the cells were supplemented with 50 µM cycloheximide plus vehicle (DMSO), or 10 µM lycorine for indicated time. SCAP was detected by WB (n = 3). (C, E and F) HL-7702 cells were pretreated with 10 mM 3-MA (C), bafilomycin A1 (E) or an inhibitor mixture (10 mM NH4Cl and 100 µM leupeptin) (F) for 1 h. Afterward, the cells were supplemented with 20 µM lycorine for 8 h, SCAP was detected by WB (n = 3). (D) The wild type, atg5−/-, atg3−/- and atg7−/- MEF cells were treated with or without 20 µM lycorine for 8 h. The SCAP protein was detected by WB (n = 3). (G) HL-7702 cells were transfected with EGFP-SCAP for 24 h, then the cells were treated with 20 µM lycorine for 4 h, the lysosome was stained with LysoTracker™ Red. After the treatment, the images were captured with confocal microscopy (n = 3). Quantification of colocalizations. The analysis of Mander’s colocalization coefficient was performed as detailed in the Materials and Methods. (H-K) The wild type (H), atg3−/- (I), atg5−/- (J) or atg7−/- (K) MEF cells were pretreated with or without fatostatin (20 µM) for 1 h. The cells then were treated with or without 20 µM lycorine for 4 h. After the treatment, the images were captured with confocal microscopy (n = 3). Quantification of colocalizations. The analysis of Mander’s colocalization coefficient was performed as detailed in the Materials and Methods. Error bars are represented as mean ± SEM. Statistical analysis was done with one-way ANOVA (Dunnett’s posttest). *p < 0.05, **p < 0.01, ***p < 0.001
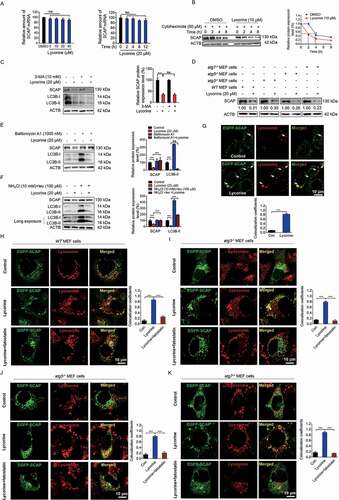
Figure 5. SQSTM1 mediates the lysosomal degradation of SCAP induced by lycorine. (A) A scheme for identified the proteins interacted with SCAP, which promoted by lycorine using IP-MS. (B) The experimental results were presented by volcano maps. (C) The top ten proteins interacting with SCAP promoted by lycorine. (D) 293 T cells were transfected with or without the indicated plasmids for 24 h. Immunoblotting for indicated proteins after immunoprecipitation of MYC from 293 T cells (n = 3). (E) HL-7702 cells were treated with or without 20 µM lycorine for 8 h. Immunoblotting for indicated proteins after immunoprecipitation of SCAP from HL-7702 cells (n = 3). (F) The schematic diagram of SCAP and its truncations. (G) 293 T cells transfected with Flag-SQSTM1 and the indicated HA-tagged SCAP constructs treated with 20 µM lycorine for 8 h and were subjected to immunoprecipitation with an anti-Flag antibody and levels of the co-immunoprecipitated HA-SCAP were detected with an anti-HA antibody (n = 3). (H) The schematic diagram of SQSTM1 and its truncations. (I-J) 293 T cells transfected with MYC-tagged SCAP and indicated Flag-SQSTM1-truncated constructs were treated with 20 µM lycorine and then were subjected to immunoprecipitation with an anti-MYC antibody. The levels of the co-immunoprecipitated Flag-SQSTM1 truncations were detected with an anti-Flag antibody (n = 3). (K) 293 T cells transfected with MYC-tagged SCAP and Flag-tagged SQSTM1TB (TRAF6 binding) domain (170–260) constructs were treated with 20 µM lycorine and then were subjected to immunoprecipitation with an anti-MYC antibody. The levels of the co-immunoprecipitated Flag-SQSTM1 TB domain was detected with an anti-Flag antibody (n = 3). Error bars are represented as mean ± SEM. Statistical analysis was done with one-way ANOVA (Dunnett’s posttest). *p < 0.05, **p < 0.01, ***p < 0.001
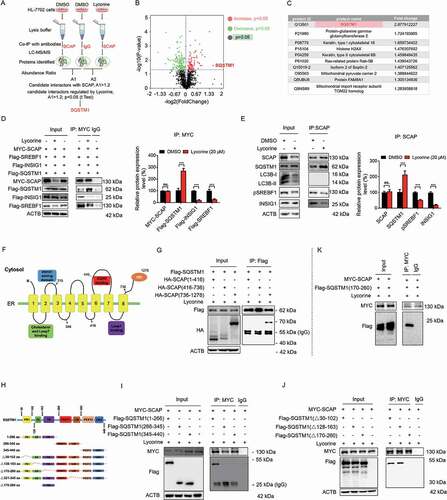
Figure 6. Lycorine-induced SCAP degradation depends on the TB domain of SQSTM1 and can be reversed by fatostatin. (A) 293 T cells were transfected with the indicated plasmids for 24 h. Immunoblotting for indicated proteins after immunoprecipitation of MYC from 293 T cells (n = 3). (B) HL-7702 cells were pretreated with 20 µM fatostatin for 1 h. The cells were treated with or without 20 µM lycorine for 8 h. The protein level of SCAP was detected by WB (n = 3). (C) HL-7702 cells were transfected with EGFP-SCAP and SQSTM1-OFP for 48 h, then the cells were pretreated with 20 µM fatostatin for 2 h, then lycorine was added to these cells for another 4 h. The lysosome was stained by LysoTracker™ Red. After the treatment, the images were captured with confocal microscopy (n = 3). Quantification of colocalizations. The analysis of Mander’s colocalization coefficient was performed as detailed in the Materials and Methods. (D) The WT or sqstm1−/- MEF cells were replenished the indicated truncation of SQSTM1 for 24 h. The cells were treated with 20 µM lycorine for 8 h. The protein level of SCAP was detected by WB (n = 3). (E-K) The sqstm1−/- cells were replenished with the indicated truncation of SQSTM1 for 24 h. cells were treated with 20 µM lycorine for 4 h. After the treatment, the images were captured with confocal microscopy (n = 3). (L) Quantification of colocalizations. The analysis of Mander’s colocalization coefficient was performed as detailed in the Materials and Methods. (M) The protein level of SQSTM1 was detected by WB. Error bars are represented as mean ± SEM. Statistical analysis was done with one-way ANOVA (The Dunnett’s posttest). ***p < 0.001
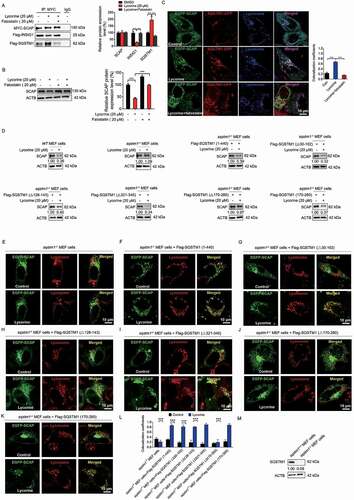
Figure 7. Lycorine ameliorates diet-induced obesity, hyperlipidemia, hepatic steatosis, and insulin resistance in mice. Male C57BL/6 J mice at 6 weeks of age were randomly grouped (n = 6). Mice were allowed ad libitum access to water and different types of diets (HFD, high fat diet). Vehicle (0.5% CMC-Na, chow), lycorine (15 or 30 mg/kg), or lovastatin (30 mg/kg) was administrated to mice by gastric irrigation every day. After 6 weeks of treatment, the mice were sacrificed and subjected to a series of analyzes as indicated below. (A) Food intake (B) Bodyweight. (C) The ratio of fat and body weight or lean. (D) The effect of lycorine on serum TG, TC, LDL-c and HDL-c levels. (E) The effect of lycorine on serum GPT/ALT and GOT1/AST levels. (F) Effect of lycorine on TG and TC levels in the liver. (G) The weight of liver and WAT. (H) Oil red staining in liver and histological analysis of liver, WAT and BAT. Error bars are represented as mean ± SEM. Statistical analyzes were done with two-way ANOVA (Bonferroni’s test) (A) or one-way ANOVA (Dunnett’s posttest) (B-G). *p < 0.05, **p < 0.01, ***p < 0.001 vs HFD
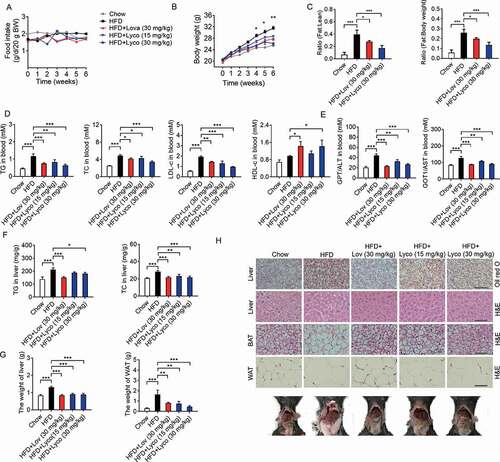
Figure 8. Lycorine decreases the protein level of SCAP-SREBF and regulates the expression of metabolic genes in vivo. (A) For each group, equal amounts of total proteins from the livers of 3 mice were subjected to WB with indicated antibodies. Statistical analysis of each protein expression was adjusted to ACTB as the loading control. (B-F) total RNAs were extracted from liver tissue, gene expression in mice liver. (G) total RNAs were extracted from WAT tissue, gene expression in WAT. n = 3, *p < 0.05, **p < 0.01, ***p < 0.001
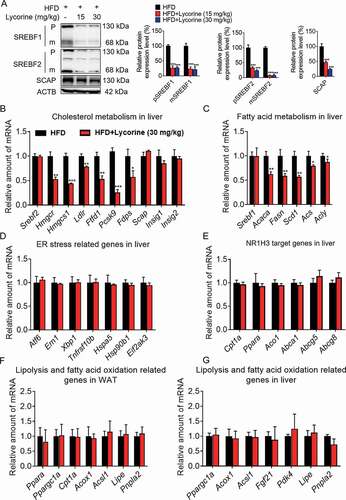
Figure 9. Schematic diagram of lycorine. Sterols block the SCAP-SREBFs transport from the ER to the Golgi apparatus by sequestering the SCAP-SREBFs complex in the ER lumen, which is a potential risk factor of ER stress. Lycorine binds to SCAP at the WD40 domain, which leads to the dissociation of SCAP-SREBFs from INSIG1. Once SCAP leaves the ER, it is captured by SQSTM1 and escorted to the lysosome for degradation. When SCAP proteins are reduced, SREBFs undergoes ubiquitylation and proteasomal degradation, thus lipogenic gene expression is suppressed
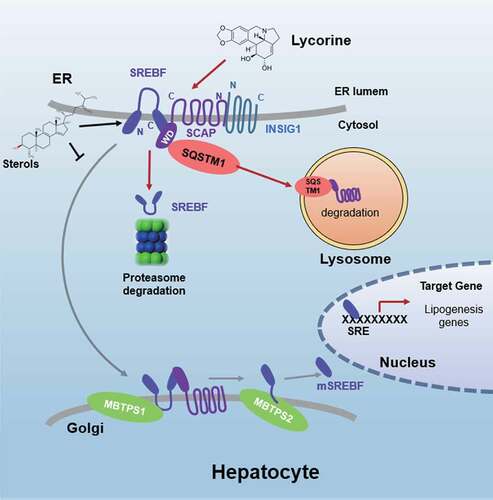
Table 1. Nucleotide sequences of gene-specific primers used for qRT-PCR, related to the experimental procedures