
Figures & data
Figure 1. Expression and clinical significance of MIR106A-5p in NPC. (A) MIR106A-5p levels in fresh NPC and non-cancerous nasopharyngeal samples detected by qRT-PCR. P-values were calculated using two-tailed Student’s t-tests. (B) MIR106A-5p levels in NP-69 and NPC cell lines were examined by qRT-PCR (one-way ANOVA). CNE-1, CNE-2, 5–8 F, and 6–10B are human NPC cell lines; NP-69 is an immortalized normal nasopharyngeal epithelial cell line. (C) Representative MIR106A-5p ISH staining of NPC tissue microarrays, scale bar: 100 μm. (D) Statistical comparison of MIR106A-5p expression across clinical stages using one-way ANOVA. (E) The ISH staining score of MIR106A-5p in NPC tissue microarrays was defined as low expression (scores of 0–8) or high expression (scores of 9–16) by the X-tile Software. Then Kaplan-Meier analysis was used to compare overall survival using the log-rank test. All experiments were conducted with three independent replicates. All graphs show mean ± SEM of at least three independent experiments. *P < 0.05, **P < 0.01, ***P < 0.001
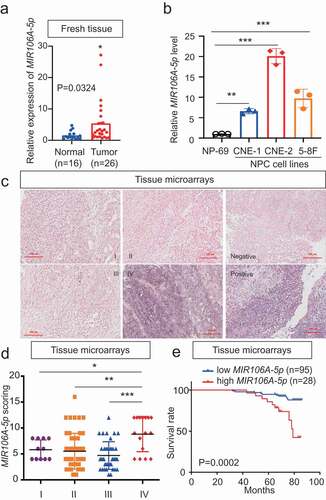
Figure 2. Silencing of MIR106A-5p inhibits NPC proliferation and migration in vivo. (A) Visualization of lung metastasis after intravenous injection of CNE-2 cells, with or without knockdown of MIR106A-5p, in BALB/c mice. Representative images of bioluminescence signals and normalized photon flux are shown. (B) Graph representing mean intensity of fluorescence 7 weeks after tumor injection (*P < 0.05, t-test). (C) CNE2 cells transfected with MIR106A-5p inhibitor and labeled with DiI were injected into the perivitelline space of zebrafish embryos. Migration of CNE2 cells was measured using fluorescence microscopy at day 8 post-injection. (D) Quantification of migratory cell numbers and analysis using Student’s t-test (**P < 0.01). (E) Cells with stable silencing of MIR106A-5p or control cells were subcutaneously transplanted in nude mice (n = 3 per group). Subcutaneous tumor volumes at day 21 are shown (*P < 0.05, t-test). (F) Immunohistochemistry (IHC) analysis of tumor MAP1LC3B and MKI67 expression across tumor groups. Scale bar: 50 μm. Quantification of IHC staining for MAP1LC3B and MKI67 expression using Student’s t-test (***P < 0.001) (G) and Pearson correlation between MAP1LC3B and MKI67 expression (H). Linear regression. All experiments were repeated three times. Data represent mean ± SEM
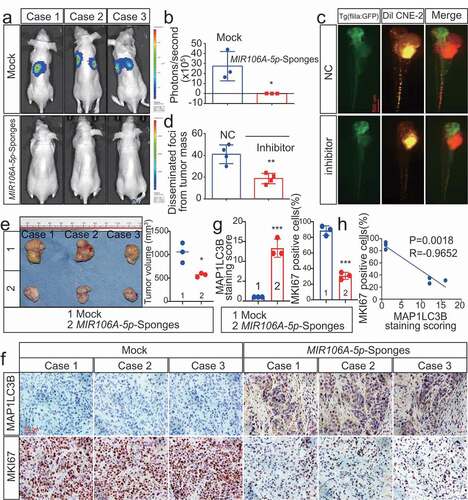
Figure 3. Silencing of MIR106A-5p promotes autophagy in NPC cells. (A) Left, immunofluorescence analysis of endogenous MAP1LC3B puncta in cells transfected with MIR106A-5p inhibitor or control. Right, total number of endogenous MAP1LC3B puncta per cell. Student’s t-test. (B) Left, transmission electron microscopy analysis of autophagy. Arrows indicate cell autophagosomes/autolysosomes. Right, quantification of the total autophagosome numbers per cell analyzed using Student’s t-tests. EBSS: Earle’s balanced salt solution. (C) Western blot (WB) analysis of changes in MAP1LC3B conversion, ATG5, and SQSTM1 levels induced by MIR106A-5p silencing in NPC cells in the absence (–) or presence (+) of 10 μmol/L chloroquine (CQ) treatment. ACTB was used as a loading control. (D-F) quantification of WB results from three independent experiments. (G-I) Cells were transiently transfected with mRFP-GFP-MAP1LC3B reporter, which differentiates between autophagosomes (GFP+ RFP+, yellow puncta) and autolysosomes (GFP− RFP+, red puncta). Cells were transfected with MIR106A-5p inhibitor in the absence or presence of CQ to inhibit autophagosome and lysosome fusion. Results were analyzed using two-way ANOVA with at least three independent replicates per condition. All experiments were repeated three times with similar results. Images in A–I are representative of three independent experiments. Data represent mean ± SEM. Unprocessed original scans of three independent blots are shown in Fig. S9
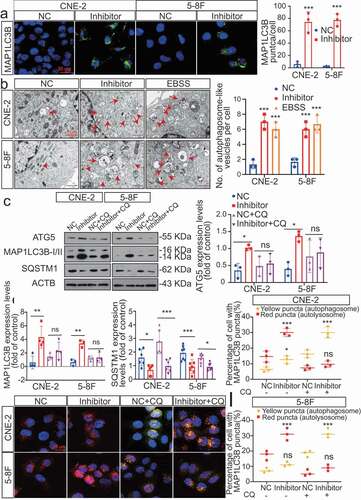
Figure 4. Blocking autophagy induced by MIR106A-5p inhibitor rescues NPC proliferation and migration. (A) WB analysis of MAP1LC3B-I, MAP1LC3B-II and SQSTM1 in cells transfected with MIR106A-5p inhibitor along with transfection of lentiviral ATG5-shRNA or mock vector. (B) Left, cell growth and viability analysis via three-dimensional spheroid formation assay. Red fluorescence represents dead cells and green fluorescence represents live cells. Right, spheroid diameter analyzed using one-way ANOVA (**P < 0.01, scale bar: 600 μm). (C) Left, visualization of lung metastasis after intravenous injection of stated cells. Right, mean intensity of fluorescence (**P < 0.01, one-way ANOVA). (D) Left, representative NPC xenografts in mice for indicated groups (n = 5 per group). Right, tumor volumes on day 21. (E) Tumors were analyzed by IHC for MAP1LC3B expression using one-way ANOVA. Scale bar: 50 μm. (F) Schematic diagram. All experiments were repeated three times. Data represent mean ± SEM. Images in A-B and E are representative of three independent experiments. All spheroid formation for three independent experiments in B and IHC images for every subcutaneous tumor in E are shown in Fig. S8. Unprocessed original scans of three independent blots are shown in Fig. S9
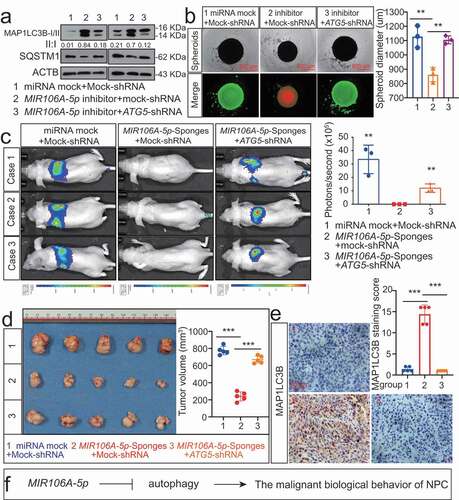
Figure 5. MIR106A-5p directly targets BTG3. (A) Venn diagram depicting predicted MIR106A-5p targets. (B) Venn diagram depicting MIR106A-5p targets with high target scores. (C) Schematic of predicted MIR106A-5p binding sequences in the 3′-UTR of BTG3. (D) MIR106A-5p overexpression reduced wild-type BTG3 3′-UTR luciferase activity but not mutant BTG3 3′-UTR luciferase activity (analyzed using Student’s t-test). (E) BTG3 levels in fresh NPC and non-cancerous nasopharyngeal samples detected by qRT-PCR. P-values were calculated using two-tailed Student’s t-tests. (F) WB analysis of changes in BTG3 levels induced by MIR106A-5p silencing. (G) qRT-PCR analysis of changes in BTG3 levels induced by MIR106A-5p silencing. (H) Representative IHC images of BTG3 staining in tissues collected from two groups of NPC xenografts. Scale bar: 50 μm. (I) Quantification of IHC staining for MAP1LC3B expression using Student’s t-test (**P < 0.01). (J) IHC staining of BTG3 expression in NPC tissue microarrays. Pearson correlation between BTG3 and MIR106A-5p expression was analyzed. (K) The ISH staining score of BTG3 in NPC tissue microarrays was defined as low expression (scores of 0–7) or high expression (scores of 8–16) by the X-tile Software. Kaplan-Meier analysis was used to compare overall survival using the log-rank test. All experiments were conducted with three independent replicates. All graphs show mean ± SEM of at least three independent experiments. Unprocessed original scans of three independent blots for F are shown in Fig. S9
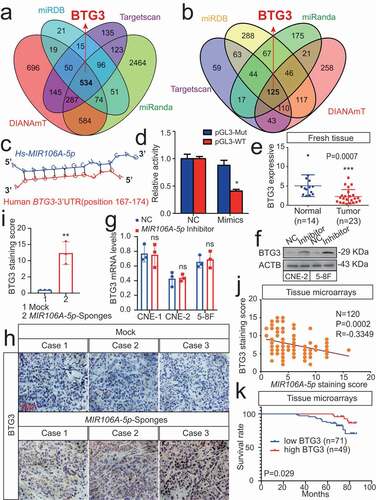
Figure 6. The MIR106A-5p-BTG3 axis regulates NPC cell autophagy. (A) Expression of MAP1LC3B conversion, ATG5, and SQSTM1 was measured by WB in MIR106A-5p-silenced NPC cells transfected with BTG3-specific siRNA or control. (B) Detection of autophagic flux with the mRFP-GFP-LC3 reporter in MIR106A-5p-silenced NPC cells transfected with BTG3-specific siRNA or control. Scale bar: 25 μm. (C) Analysis of autophagic flux using two-way ANOVA with at least three independent replicates per condition (**P < 0.01, ***P < 0.001). (D) Left, immunofluorescence analysis of endogenous MAP1LC3B puncta in cells. Scale bar: 30 μm. Right, total number of endogenous MAP1LC3B puncta per cell analyzed using two-way ANOVA with at least three independent replicates per condition (***P < 0.001). (E) Left, transmission electron microscopy analysis of autophagy. Arrows, autophagosomes/autolysosomes. Scale bar: 1 μm. Right, the total numbers of autophagosomes per cell were quantified and analyzed using two-way ANOVA with at least three independent replicates per condition (***P < 0.001). Experiments were conducted with at least three independent replicates. All experiments were repeated three times with similar results. Images in A-B and D-E are representative of three independent experiments. Data represent mean ± SEM. Unprocessed original scans of three independent blots are shown in Fig. S9
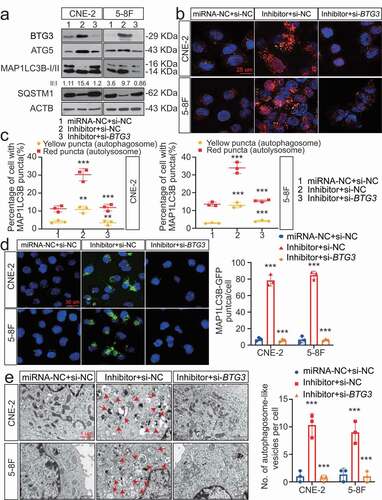
Figure 7. The MIR106A-5p-BTG3 axis regulates proliferation and migration in NPC cells. (A) MIR106A-5p-silenced NPC cells were transfected with lentiviral BTG3-shRNA or control and inoculated into nude mice by tail vein injection. Visualization of lung metastasis in different groups are representative of three independent experiments. (B) Graph representing the mean intensity of fluorescence (*P < 0.05, one-way ANOVA). (C) MIR106A-5p-silenced NPC cells were transfected with BTG3-siRNA or control and labeled with DiI. Labeled cells were injected into the perivitelline space of zebrafish embryos to detect tumor cell metastasis by fluorescence microscopy. (D) Quantification of migratory cell numbers (**P < 0.01, ***P < 0.001, one-way ANOVA). (E) Left, representative NPC xenografts in mice for indicated groups (n = 5 per group). Right, tumor volumes on day 21. (F) Tumors were analyzed by IHC for BTG3, MKI67, and MAP1LC3B expression using one-way ANOVA. Scale bar: 50 μm. Quantification of IHC staining for BTG3 (G), MKI67 (H), and MAP1LC3B (I) expression using one-way ANOVA (***P < 0.001). (J) Pearson correlation between BTG3 and MKI67 expression and (K) MAP1LC3B and BTG3 expression. Linear regression. (L) Schematic diagram. All experiments were repeated three times. Data represent mean ± SEM. All IHC images for every subcutaneous tumor in F are shown in Fig. S8
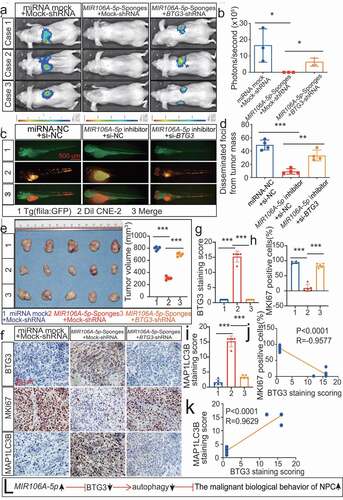
Figure 8. The MIR106A-5p-BTG3 axis regulates NPC cell autophagy by activating MAPK signaling. Rescue experiments with Transwell assay (A-B) and three-dimensional spheroid formation assay (C-D) were performed using inhibitors of AKT and MAPK signaling using MIR106A-5p-silenced NPC cells transfected with BTG3-specific siRNA or control. MK2206: AKT inhibitor. PD184352: MAP2K1 inhibitor. (B) The number of cells that invaded through the membrane was counted in 3 fields per group with three independent replicates (***P < 0.001, one-way ANOVA). Data represent mean ± SEM. (D) Spheroid diameters were analyzed using one-way ANOVA (*P < 0.05, **P < 0.01, ***P < 0.001, scale bar: 600 μm). (E) Rescue experiments with WB analysis of p-MAP2K1/MAP2K1, p-MAPK1/MAPK1, and p-MTOR/MTOR levels, as well as autophagy-related gene levels, in different conditions in NPC cells. PD184352: MAP2K1 inhibitor, BTG3: BTG3 overexpression vector, MAP2K1: MAP2K1 overexpression vector. All experiments were repeated three times with similar results. Images in A, C, and E are representative of three independent experiments. Data represent mean ± SEM. All spheroid formation images of three independent experiments in C are shown in Fig. S8. Unprocessed original scans of three independent blots are shown in Fig. S9
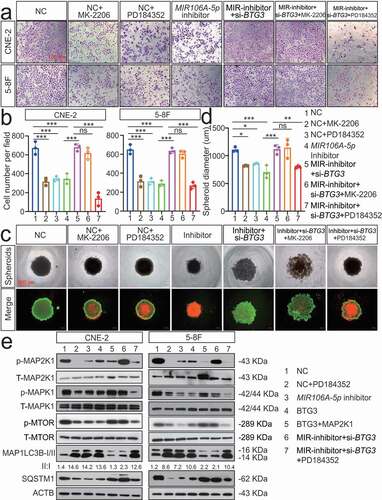
Figure 9. MIR106A-5p overexpression in NPC results from increased transactivation by EGR1 and SOX9. (A) Schematic diagram of predicted EGR1 and SOX9 binding sequences within a region 136 bp and 1472 upstream of the MIR106A-5p gene locus TSS. (B) Immunoblotting analysis of EGR1 and SOX9 in NP-69 and NPC cells. qRT-PCR analysis of MIR106A-5p expression after EGR1 (C) and SOX9 (D) knockdown or EGR1 and SOX9 overexpression (E). (F) Binding of transcription factors (EGR1 and SOX9) to the MIR106A-5p promoter in NPC cells was confirmed by dual-luciferase reporter assays. (G-H) ChIP assays were performed to determine the binding of both EGR1 and SOX9 to the MIR106A-5p promoter region in NPC cells. (I) IHC analysis of SOX9 expression in NPC tissue microarrays and correlation between MIR106A-5p expression levels and SOX9 staining score using Spearman’s rank correlation analysis. Kaplan-Meier analysis of the association of SOX9 expression was used to estimate survival time in NPC patients (J) and a GEO database cohort (accession number GEO: GSE102349) (K); differences in survival were analyzed using the log-rank test. (L) Schematic overview of the role of MIR106A-5p in promoting the malignant phenotype in NPC by modulating autophagy. MIR106A-5p targets BTG3 to activate MAPK signaling, which accelerates malignant NPC phenotypes by autophagy suppression. MIR106A-5p overexpression in NPC results from increased transactivation by EGR1 and SOX9. Experiments were conducted with at least three independent replicates. Data represent mean ± SEM. One-way ANOVA was used for statistical analysis (*P < 0.05, **P < 0.01, ***P < 0.001)
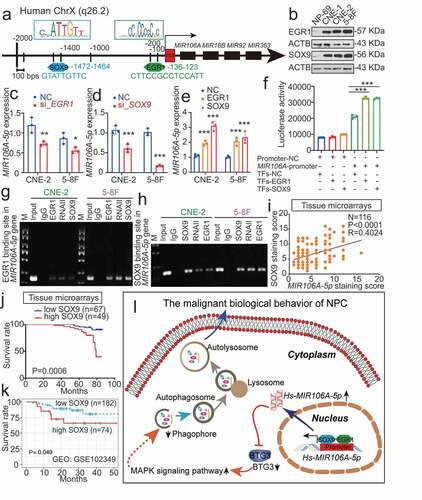
Table 1. Antibodies used for western blot and immunohistochemistry