Figures & data
Figure 1. EPA reduces an HFD-induced phospholipid accumulation in the PTEC lysosomes. (A, B) Images of PAS staining, LAMP1 immunostaining, toluidine blue staining, and Nile red staining of the kidney cortical regions of the nonobese, obese, and EPA-supplemented obese mice (n = 6 to 7 in each group). Sections were immunostained for LRP2, a marker of proximal tubules (blue) (A, middle) and counterstained with DAPI (blue) (B). (C) The number (per proximal tubule) and the sizes (per area [mm2]) of Nile red-positive puncta under each condition was counted in at least 10 high-power fields (× 600) (each high-power field contains 10 to15 proximal tubules) (n = 3 in each group). (D-I, K-P) Electron micrographs of the kidneys of the obese and the EPA-supplemented obese Atg5 F/F-CTRL (D-I) and atg5-cKO mice (K-P) (n = 3 in each group). (J) Images of PAS-stained kidney cortical regions of the nonobese, obese, and EPA-supplemented obese atg5-cKO mice (n = 6 to 7 in each group). Bars: 50 μm (A, B, J), 5 μm (D, E, G, H, K, L, N, O), and 500 nm (F, I, M, P). Values represent means ± SE. Statistically significant differences (*P < 0.05) are indicated. All images are representative of multiple experiments. BM, basement membrane; L, lysosomes; TL, tubular lumen; M, mitochondria; arrows, autophagosomes, *, nucleus. Magnified images of lysosomes or mitochondria are presented. CTRL: Atg5 F/F-CTRL mice; cKO: atg5-cKO mice
![Figure 1. EPA reduces an HFD-induced phospholipid accumulation in the PTEC lysosomes. (A, B) Images of PAS staining, LAMP1 immunostaining, toluidine blue staining, and Nile red staining of the kidney cortical regions of the nonobese, obese, and EPA-supplemented obese mice (n = 6 to 7 in each group). Sections were immunostained for LRP2, a marker of proximal tubules (blue) (A, middle) and counterstained with DAPI (blue) (B). (C) The number (per proximal tubule) and the sizes (per area [mm2]) of Nile red-positive puncta under each condition was counted in at least 10 high-power fields (× 600) (each high-power field contains 10 to15 proximal tubules) (n = 3 in each group). (D-I, K-P) Electron micrographs of the kidneys of the obese and the EPA-supplemented obese Atg5 F/F-CTRL (D-I) and atg5-cKO mice (K-P) (n = 3 in each group). (J) Images of PAS-stained kidney cortical regions of the nonobese, obese, and EPA-supplemented obese atg5-cKO mice (n = 6 to 7 in each group). Bars: 50 μm (A, B, J), 5 μm (D, E, G, H, K, L, N, O), and 500 nm (F, I, M, P). Values represent means ± SE. Statistically significant differences (*P < 0.05) are indicated. All images are representative of multiple experiments. BM, basement membrane; L, lysosomes; TL, tubular lumen; M, mitochondria; arrows, autophagosomes, *, nucleus. Magnified images of lysosomes or mitochondria are presented. CTRL: Atg5 F/F-CTRL mice; cKO: atg5-cKO mice](/cms/asset/4c22472d-56e8-48c4-ad7d-b4be33152509/kaup_a_1782034_f0001_oc.jpg)
Figure 2. EPA improves the HFD/PA-induced mitochondrial dysfunction in PTECs. (A, B) Images of COX (A) and SDH (B) staining in the kidney cortical regions of the nonobese, obese, and EPA-supplemented obese Atg5 F/F-CTRL and atg5-cKO mice (n = 3 in each group). (C, D) The mitochondrial membrane potential (C) and ROS (D) of the autophagy-competent and autophagy-deficient PTECs treated with each treatment (0.25% BSA, 0.25 mM PA, 0.125 mM OA, 0.05 mM EPA, PA plus OA, and PA plus EPA) for 12 h were assessed by TRME- (n = 4 to 6) and MitoSOX Red-staining (n = 9 to 11), respectively. Quantitative data of relative intensity were also provided. (C, D) Values are normalized against the signal intensity of BSA-treated autophagy-competent PTECs. (E) Cell survival of the autophagy-competent and autophagy-deficient PTECs incubated with the indicated concentrations of BSA, PA, OA, EPA, PA plus OA, or PA plus EPA for 12 h (n = 8). (F) Representative images of western blot analysis for cleaved CASP3 [Asp175] (n = 3). Bars: 100 μm (A, B) and 10 μm (C, D). Data are provided as means ± SE. Statistically significant differences. *P < 0.05 (C, D); *P < 0.05 vs. autophagy-competent cells of corresponding treatment; #P < 0.05 vs. BSA-treated control cells; †P < 0.05 vs. PA-treated control cells (E) are indicated. All images are representative of multiple experiments. Atg5+: autophagy-competent PTEC; atg5−/−: autophagy-deficient PTEC. CTRL: Atg5 F/F-CTRL mice; cKO: atg5-cKO mice
![Figure 2. EPA improves the HFD/PA-induced mitochondrial dysfunction in PTECs. (A, B) Images of COX (A) and SDH (B) staining in the kidney cortical regions of the nonobese, obese, and EPA-supplemented obese Atg5 F/F-CTRL and atg5-cKO mice (n = 3 in each group). (C, D) The mitochondrial membrane potential (C) and ROS (D) of the autophagy-competent and autophagy-deficient PTECs treated with each treatment (0.25% BSA, 0.25 mM PA, 0.125 mM OA, 0.05 mM EPA, PA plus OA, and PA plus EPA) for 12 h were assessed by TRME- (n = 4 to 6) and MitoSOX Red-staining (n = 9 to 11), respectively. Quantitative data of relative intensity were also provided. (C, D) Values are normalized against the signal intensity of BSA-treated autophagy-competent PTECs. (E) Cell survival of the autophagy-competent and autophagy-deficient PTECs incubated with the indicated concentrations of BSA, PA, OA, EPA, PA plus OA, or PA plus EPA for 12 h (n = 8). (F) Representative images of western blot analysis for cleaved CASP3 [Asp175] (n = 3). Bars: 100 μm (A, B) and 10 μm (C, D). Data are provided as means ± SE. Statistically significant differences. *P < 0.05 (C, D); *P < 0.05 vs. autophagy-competent cells of corresponding treatment; #P < 0.05 vs. BSA-treated control cells; †P < 0.05 vs. PA-treated control cells (E) are indicated. All images are representative of multiple experiments. Atg5+: autophagy-competent PTEC; atg5−/−: autophagy-deficient PTEC. CTRL: Atg5 F/F-CTRL mice; cKO: atg5-cKO mice](/cms/asset/c8956a16-82d5-4b78-b9e5-c1c466475226/kaup_a_1782034_f0002_oc.jpg)
Table 1. Metabolic profiles of the nonobese, obese, and EPA-supplemented obese mice
Figure 3. EPA alleviates the HFD/PA-induced lysosomal dysfunction and impairment in autophagic flux. (A) PTECs stably expressing GFP-MAP1LC3 were stained with LysoTracker Red, and counterstained with DAPI (blue) after each treatment (0.25% BSA, 0.25 mM PA, 0.125 mM OA, 0.05 mM EPA, PA plus OA, or PA plus EPA) for 12 h (n = 5). The number of GFP- or the LysoTracker-positive or double-positive dots was counted (right). (B) PTECs were stained with the pH indicator LysoSensor Yellow/Blue after each treatment for 12 h (n = 5). The blue/yellow ratio is presented (right). (A, B) Bars: 10 μm. (C) Autophagic flux in the PTECs treated with each treatment for 6 h was assessed by the conversion from MAP1LC3-I to MAP1LC3-II after bafilomycin A1 treatment (n = 3, respectively). The levels of MAP1LC3-II and autophagic flux index (defined as the proportion of the levels of MAP1LC3-II in the presence of bafilomycin A1 to the levels of MAP1LC3-II in the absence of bafilomycin A1) are shown. Data are provided as means ± SE. Statistically significant differences (*P < 0.05 vs. PA treated cells (A, B); * P < 0.05 (C) are indicated. All images are representative of multiple experiments
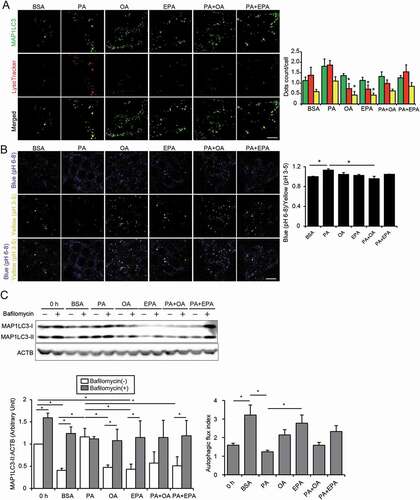
Figure 4. EPA alleviates the HFD/PA-induced increase in the autophagy demand. (A, B) A fluorescent FA pulse-chase assay was performed to investigate whether EPA modulated the PA-induced phospholipid redistribution into the lysosomes for autophagic degradation in PTECs. (A) Schematic illustration of a pulse-chase assay. (B) FL-HPC-loaded PTECs were chased after each treatment (0.25% BSA, 0.25 mM PA, 0.125 mM OA, 0.05 mM EPA, PA plus OA, or PA plus EPA) for 6 h (n = 4 to 5), and the subcellular localization of FL-HPC was determined by staining with the LysoTracker Red. To determine phospholipid accumulation in the lysosomes, the number and size of the merged dots were counted (right). (C) Kidney cortical regions of the nonobese, obese, and EPA-supplemented obese mice (Atg5 F/F-CTRL and atg5-iKO) were immunostained for SQSTM1 and ubiquitin after treatment with vehicle or tamoxifen 3 weeks before euthanasia (n = 4 to 5 in each group). Magnified images from the tamoxifen-treated atg5-iKO mice are also presented. The number of SQSTM1- or ubiquitin-positive dots was counted in at least 10 high-power fields (× 400). Bars: 10 μm (B, C). Data are provided as means ± SE. Statistically significant differences (*P < 0.05) are indicated. All images are representative of multiple experiments. CTRL: Atg5 F/F-CTRL mice; iKO: atg5-iKO mice
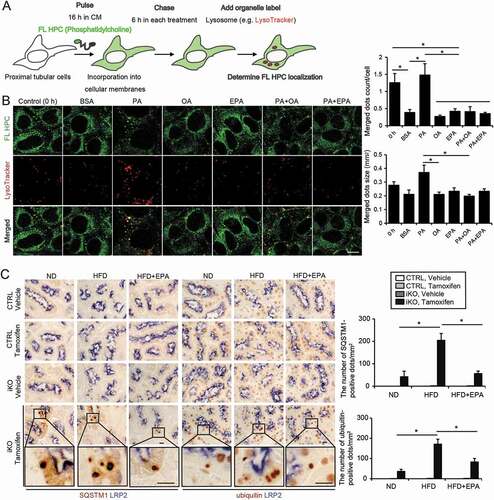
Figure 5. EPA increases LD formation by supplementation with FAs from cellular membranes during starvation. (A-D) Images and quantification of Oil Red O-staining, TGs level per g kidney weight (gKW), and the mRNA levels of Plin2, Dgat1, Dgat2, and Ppargc1a in the kidney cortical regions of the nonobese, obese, and EPA-supplemented obese mice that were either fed or subjected to 24 h of starvation (n = 4 to 7 in each group). (A) Counterstaining was performed with hematoxylin. (E, F) To investigate whether starvation-induced autophagy contributed to the production and delivery of FAs to LD stores, a fluorescent FA pulse-chase assay was performed. (E) Schematic illustration of an FA pulse-chase assay. (F) FL-HPC-loaded autophagy-competent, and autophagy-deficient PTECs were chased after treatment with Hank’s balanced salt solution for 3 h, and the subcellular localization of FL-HPC was determined. LDs were labeled with BODIPY 665/676 (white). Autophagosomes were immunostained with MAP1LC3 (red) and counterstained with DAPI (blue) (n = 5 in each group). To determine phospholipid redistribution in LDs, the number of the FL-HPC and BODIPY 665/676-merged dots were counted. Bars: 50 μm (A) and 10 μm (F). Data are provided as means ± SE. Statistically significant differences (*P < 0.05) are indicated. All images are representative of multiple experiments. Atg5+: autophagy-competent PTEC; atg5−/−: autophagy-deficient PTEC
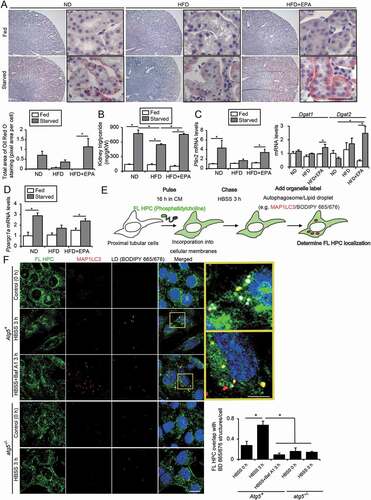
Figure 6. EPA promotes an FA transfer from LDs to the mitochondria for beta-oxidation. A fluorescent FA pulse-chase assay was performed to trace the fate of FAs modulated by OA or EPA. (A) Schematic illustration of an FA pulse-chase assay. (B, C) Autophagy-competent or autophagy-deficient PTECs were supplied with 1 μM of Red C12 and each treatment (0.25% BSA, 0.25 mM PA, 0.125 mM OA, 0.05 mM EPA, PA plus OA, or PA plus EPA) for 12 h, and, rinsed, administered without Red C12 for 1 h, and the subcellular localization of Red C12 was determined (n = 5 in each group). (B) LDs were labeled with BODIPY 493/503, and lysosomes were immunostained for LAMP1 (white) and counterstained with DAPI (blue). To determine incorporation of Red C12 into LDs or lysosomes, the number of the Red C12 and BODIPY or LAMP1-merged dots were counted, respectively. (C) Mitochondria were labeled with MitoTracker Green FM. To determine redistribution into the mitochondria, the relative intensity of the merged area (yellow) was assessed. (D) The mRNA levels of Tfeb, Ppargc1a, Ppara, and FA beta-oxidation genes were assessed in the autophagy-competent and autophagy-deficient PTECs treated with each treatment for 12 h (n = 6). Cpt1a: carnitine palmitoyltransferase 1a; Acads: acyl-Coenzyme A dehydrogenase, short-chain; Acadl: acyl-Coenzyme A dehydrogenase, long-chain; Acadvl: acyl-Coenzyme A dehydrogenase, very long chain. (B, C) Bars: 10 μm. Data are provided as means ± SE. Statistically significant differences (*P < 0.05 vs. autophagy-competent cells of corresponding treatment; #P < 0.05 vs. BSA-treated control cells) are indicated. All images are representative of multiple experiments. Atg5+: autophagy-competent PTEC; atg5−/−: autophagy-deficient PTEC
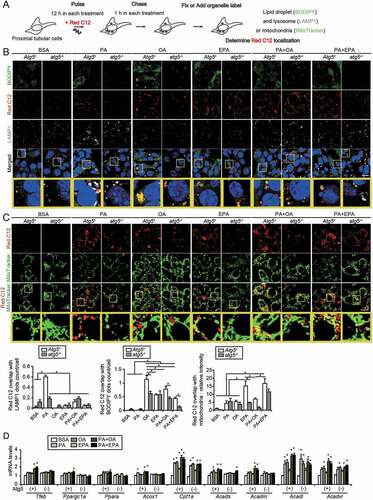
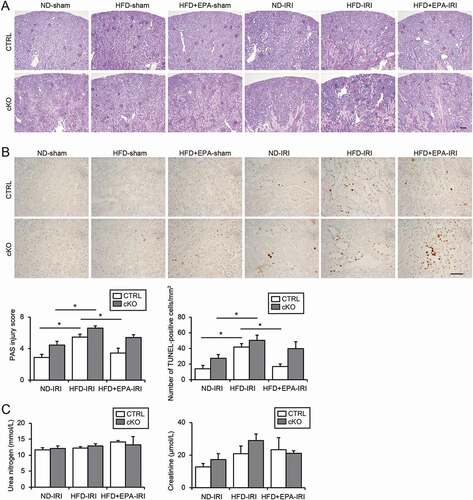
Figure 7. EPA improves the HFD-induced vulnerability toward an IRI in obese mice. (A, B) Images of PAS- (A) and TUNEL- (B) staining on kidney cortexes of the nonobese, obese, and EPA-supplemented obese Atg5 F/F-CTRL and atg5-cKO mice 2 d after a unilateral IRI or sham operation (n = 5 to 11 in each group). (A) The tubular injury score was shown. (B) The number of TUNEL-positive PTECs was calculated in at least 10 high-power fields (× 400). Bars: 100 μm (A) and 50 μm (B). (C) The plasma urea nitrogen and creatinine were measured. Data are provided as means ± SE. Statistically significant differences (*P < 0.05) are indicated. All images are representative of multiple experiments. CTRL: Atg5 F/F-CTRL mice; cKO: atg5-cKO mice