Figures & data
Figure 1. In the presence of HIV-1 Vpr, the neuronal cells accumulate SNCA/α-synuclein aggregates. (A) Using human brain tissues, we performed a fluorescent staining using anti-SNCA antibody. (B) The data are the means ± s.d. area distribution was calculated with imagej software. n = 3 independent experiments. (C) Using macaque brains tissues, we performed immunohistochemistry staining using anti-SNCA antibody. (D) The data are the means ± s.d. area distribution was calculated with ImageJ software. n = 2. (E) Protein extracts were prepared from SH-SY5Y cells treated with rVpr treated with 100 ng/ml Vpr every 4 days for 3 weeks. SDS-PAGE western blot was performed using anti-SNCA or -GAPDH antibodies. (F) Data are means ± SD of triplicate samples. n = 3 independent experiments. The relative protein level was determined from the band intensity using imageJ software and normalized relative to the GAPDH. (G) SH-SY5Y cells treated with 100 ng/ml Vpr every 4 days for 3 weeks, we performed an immunofluorescent staining using anti-SNCA antibody. endogenous level of SNCA increased in all Vpr samples compared to the mock. (H) GFP-SNCA aggregates in lysosomes (mCherry-LAMP1) of SH-SY5Y cells in presence of Vpr. the nuclei are stained in blue with DAPI
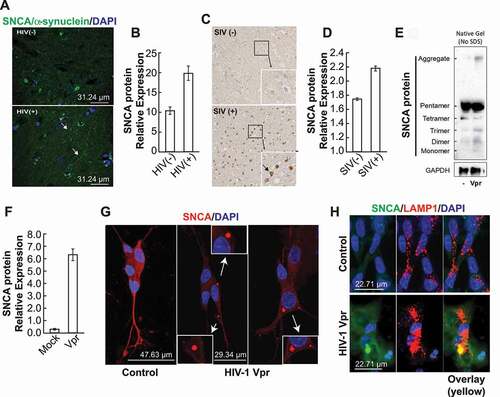
Figure 2. Enlarged autophagic vacuoles and lysosomes in presence of HIV-1 Vpr. (A) SH-SY5Y cells, after differentiation, were treated with Vpr 100 ng/ml and/or 10 μM chloroquine for 6 h and then harvested for the western blot analysis. the data are the means ± s.d. LC3 protein relative expression was calculated with imageJ software. n = 3 independent experiments and presented as histogram. (B) HIV-1 Vpr increases the LC3-positive vacuoles formation, marker of autophagosomes. SH-SY5Y cells were transfected with GFP-LC3 and then after differentiation, the cells were treated with Vpr 100 ng/ml for 6 h and/or 10 μM chloroquine. the data are the means ± s.d. area distribution was calculated with imageJ software. n = 3 independent experiments and presented as histogram using arbitrary units. (C) HIV-1 Vpr triggers lysosomal swelling and changes the lysosome positioning in SH-SY5Y cells stably expressing LAMP1-mCherry, after differentiation, and treated with Vpr 100 ng/ml. the areas of interest have been circled (dashed) for more clarity. (D) Lysosomes in presence of Vpr became extremely enlarged and round (see fig. S2). (E) Primary mouse neurons are stained with acridine orange that stains acidic compartments such as lysosomes in red. (F) SH-SY5Y cells treated 3 weeks with HIV-1 Vpr. layers of cells were analyzed by transmission electron microscopy (TEM) to visualize mitochondria and autophagy/lysosome pathway organelles. mitochondria are marked M, autophagosomes are marked AP, lysosomes are marked L and multilamellar bodies are marked MLB
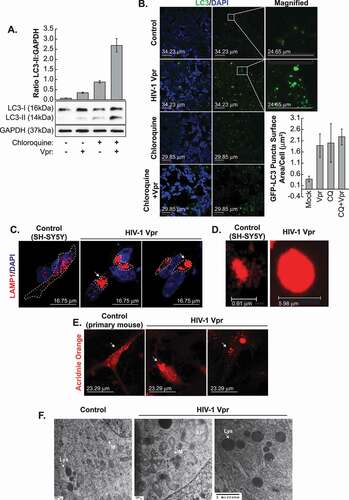
Figure 3. The lysosome dysfunction is directly linked to the presence of HIV-1 Vpr. (A) Schematic representation of the plasmids used, pNL4-3, pNL4-3ΔEnv, and pNL4-3ΔVpr. (B) HIV-1 Vpr changes the lysosome positioning and enlarges the lysosomes. SH-SY5Y cells stably expressing mCherry-LAMP1 were co-cultured with U87-MG cells transfected with 0.5 μg of pcDNA3.1, 1 μg of pNL4-3 pro, pNL4-3ΔEnv, pNL4-3ΔVpr and 1 μg of pNL4-3ΔVpr + 200 ng of CMV-Vpr plasmids and visualized after 48 h. note that pNL4-3 was cloned into pUC18 (PvuII site), however in our transfection, we used pcDNA3.1 as the empty vector
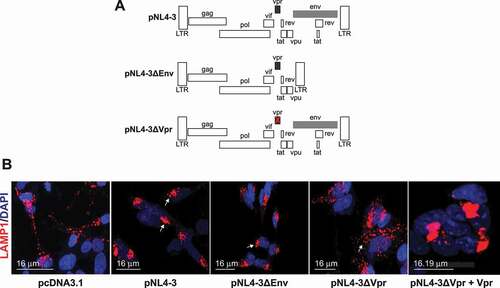
Figure 4. HIV-1 Vpr doesn’t inhibit the autophagosome-lysosome fusion. (A) SH-SY5Y cells are transfected with GFP-LC3B and LAMP1-mCherry, formaldehyde-fixed and dyed with DAPI after treatment with 100 ng/ml HIV-1 recombinant Vpr for 24 h (3 examples are displayed). (B) Number of colocalized puncta (yellow puncta) in 20 cells were counted. values are presented as the mean of three biological repeated (presented in A) ± s.d and considered statistically significant as obtained using anova test (***P < 0.001). (C) U87 MG cells are transfected with pcDNA3.1, pNL4-3, pNL4-3ΔEnv or pNL4-3ΔVpr and co-cultured with SH-SY5Y cells transfected with LC3B-GFP and LAMP1-mCherry. note that pNL4-3 was cloned into pUC18 (PvuII site), however in our transfection, we used pcDNA3.1 as the empty vector
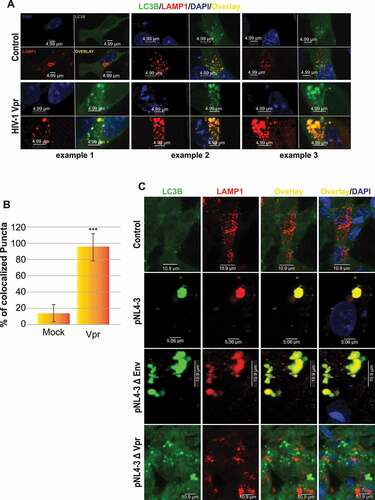
Figure 5. SH-SY5Y cells shows lysosomal impairment in presence of Vpr. (A) Model of pHluorin-mKate2-LC3 plasmid allowing a pH-sensitive monitoring of the maturation step of autophagosomes. (B) SH-SY5Y cells are transfected with pHLuorin-mKate2-LC3 and treated with Vpr 100 ng/ml for 24 h and/or 10 μM chloroquine. double-positive fluorescent puncta reflect autophagosomes (nonacidic compartments). the fluorescent puncta that are green-negative and red-positive reflect autolysosomes as acidic compartments, since pHluorin tends to decrease its fluorescence at an acidic pH. however, if the pH of the autolysosomes is increased, it is possible that autolysosomes are labeled with yellow signals (GFP+RFP+ puncta). (C) The numbers of red-positive and green-positive puncta and red-positive and green-negative puncta were quantified in more than 50 cells per experiment. representative average results from three independent experiments are shown as the means SD. (D) SH-SY5Y cells have been loaded with dextran beads conjugated to pH-insensitive rhodamine (red) and pH-sensitive fluorescein (green). after a wash, the ratio FITC/TRITC measured the variations in lysosomal pH in cells treated 24 h with Vpr 100 ng/ml. (E) SH-SY5Y cells treated 3 weeks with HIV-1 Vpr. layers of cells were analyzed by transmission electron microscopy (EM) to visualize mitochondria and autophagy/lysosome pathway organelles. mitochondria are marked M, autophagosomes are marked AP, lysosomes are marked L and multilamellar bodies are marked MLB. panel 1 is the control, panel 2 shows undigested aggregates in lysosomes, the white inclusions are usually lipids, panel 3 shows multilamellar bodies. lysosomal multilamellar bodies (MLBs) are the classical hallmarks of many lysosomal storage disorders
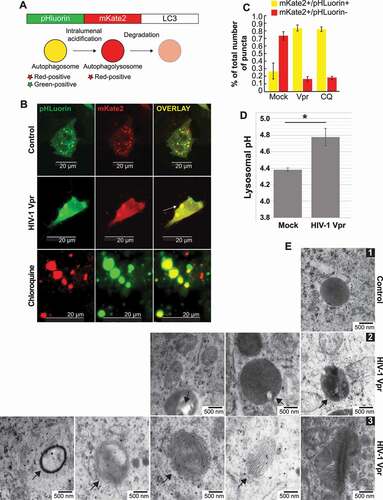
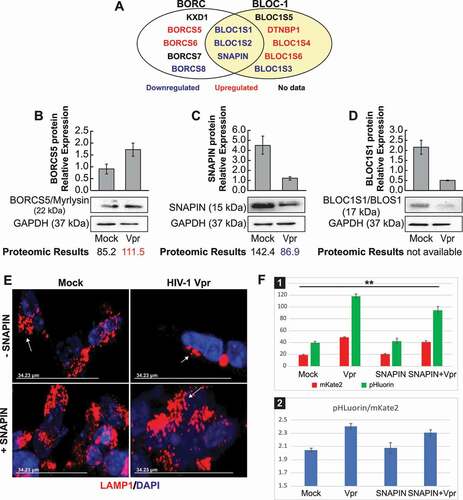
Figure 6. The SNAPIN protein is involved in HIV-1 Vpr lysosome dysfunction. (A) Model representing the BORC/BLOC-1 proteins appearing repressed in the proteomic assay (in blue) and activated (in red). (B) SH-SY5Y cells, after differentiation, were treated with Vpr 100 ng/ml for 24 h and then the harvested for the western blot. the proteomic results from a previous experiment are indicated under the western blot, if they are available. data are means ± SD of triplicate samples. n = 3 independent experiments. the relative protein level was determined from the band intensity using imageJ software and normalized relative to the GAPDH. (C) Overexpression of SNAPIN rescues the lysosomal clustering induced by Vpr. SH-SY5Y stably expressing LAMP1-mCherry are transfected with an empty vector or a vector containing SNAPIN, then the cells are treated with Vpr (100 ng/ml). (D) SH-SY5Y cells are transfected with a pHluorin-mKate2-LC3 plasmid allowing a pH-sensitive monitoring of the maturation step of autophagosomes. the green and red signals are quantified by flow cytometer (panel 1) and normalized by the red signal (panel 2). the transfection with the SNAPIN plasmid can partially rescue the lysosomal acidic pH