Figures & data
Figure 1. DDX58 protein is reduced in NAFLD/NASH mouse models. Eight mice were fed a regular chow diet and eight mice were fed a CDAHFD diet. Analysis is represented of all sixteen mice. (A) Liver tissues from mice on a standard chow diet versus and CDAHFD diet were stained for H&E to detect NASH histopathologies. Picrosirius red (PSR) was used to detect fibrosis in the liver. Scale bar: 200 μm. (B) Quantification of steatosis by percent of total area contain unstained lipid vacuoles, total number of ballooning cells and fibrosis by total area stained with PSR Scale bar: 20 μm. (C) To determine inflammation immune cell density was measured and quantified in H&E-stained liver tissue. CDAHFD mice have a significant increase in immune cells. (D) NASH model showed increased triglycerides content in collagen in CDAHFD mice. (E) Hydroxyproline showed a significant increase in collagen in the CDAHFD model. (F) Immunoblots showed a decrease in DDX58, IFIH1, and increase in STING1. (G) Quantification of immunoblots using ImageJ software to perform densitometry analysis. All statistics in this figure used an unpaired t-test (*P < 0.05; **P < 0.01; ***P < 0.001), error bars represent SEM.
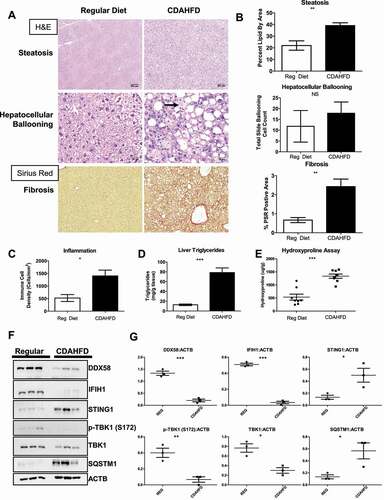
Figure 2. DDX58 activity is inhibited by Palmitic acid (A) HEK-Lucia DDX58 and HEK-Lucia DDX58 Null lines were seeded in a 384 well plate and treated with 5ʹpppdsRNA beginning at 0.00025 μg/ml final well to final concentration of 0.02 μg/mL or Palmitic acid beginning at 0 μM to a final well concentration of 1000 μM (B) for 24 h before measuring the IFN-induced Lucia luciferase content of the supernatant. (C) A549 IFIH1 KO cells were also used to look at DDX58 activity. A549 IFIH1 KO cells were treated with DDX58 ligand 5ʹ-ppp-dsRNA for 24 h and Lucia luciferase content was measured (D) A549 IFIH1 KO cells were treated with increasing dose of palmitic acid (0 μM- 1000 μM) for 24 h followed by measurement of luciferase content. Experiments were done at least three times, dose-dependent curves were done for each biological replicate.
Figure 3. Characterizing palmitic acid-induced inflammation and autophagy in vitro (A) Time course to track inflammatory and autophagy markers in cells treated with 500 μM PA for 6, 24, 48 h in the presence and/or combination with a DDX58 and IFIH1 agonist Poly:IC (.5 μg/mL). Soluble and insoluble protein lysate fractions were collected. 50 μg of protein sample were loaded and ran on 4–12% SDS page and transferred onto a nitrocellulose membrane. (B) HepG2 cells treated with 500 μM PA for 24 h fixed with 4% PFA and processed for immunofluorescence. PA-treated cells show a substantial increase in SQSTM1 inclusion bodies and increase in p-TBK1 (S172). MAVS appears unaffected by PA treatment. Scale bar: 20 μm. (C) HepG2 cells treated with 2 μg/mL of poly:IC for 5 h. Followed by 24 h with PA treatment. Cells were collected and processed for immunoblotting for SQSTM1 and LC3A/B. (D) Quantification of SQSTM1 accumulation was done using ImageJ software. Pixel density of SQSTM1 was normalized to ACTB. Quantification represents 3 different biological replicates. Each experiment was done at least 3 times, above images are representative of biological replicates.
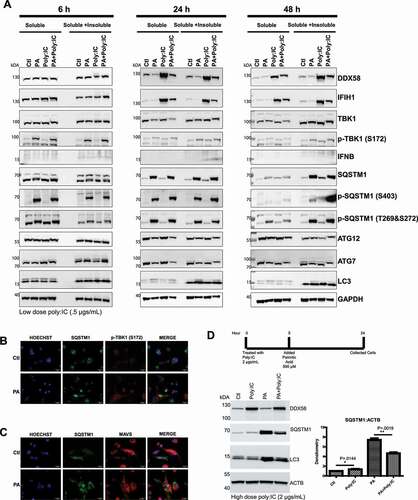
Figure 4. DDX58 KD reduces autophagy markers (A) HepG2 cells were treated with control siRNA, siMAVS, siIFIH1, and siDDX58, and treated with PA for 6 h. DDX58 knockdown showed a significant reduction in SQSTM1 levels. (B) qRT-PCR was done on three cell lines, control HepG2, siDDX58, and stable DDX58-overexpressing cells (DDX58 OE) to measure DDX58 gene expression as well as SQSTM1 gene expression. Cells were collected following a 6 h treatment with PA. Statistics were done using a students t-test (*P < 0.05; **P < 0.01; ***P < 0.001), error bars represent SEM. Black lines represent statistics performed for untreated cells between cell types, gray lines represent BSA vs. PA treatment within cell lines. (C) Immunoblots of HepG2 cells treated with control siRNA, siDDX58, and DDX58 OE were treated with 500 μM of PA for 24 h and in combination with PA and 30 uM chloroquine treatment. Immunoblots confirm DDX58 KD and DDX58 OE. DDX58 OE has undetectable amounts of SQSTM1 in PA treatment alone, and reduced levels of phosphorylated SQSTM1 (SQSTM1 [S403], and SQSTM1 [T269/S272]). Chloroquine treatment led to accumulation of p-SQSTM1 in siDDX58 and DDX58 OE but not unmodified SQSTM1. (D) Quantification of chloroquine-treated cells. Statistics were done using a two-way ANOVA followed by Bonferroni post hoc test (*P < 0.05; **P < 0.01; ***P < 0.001), error bars represent SEM. Black bars lines represent statistical analysis performed between BSA and PA treatment within a cell line, green lines represent changes with palmitic acid treatment between cell lines. Each experiment was done at least three times, images are representative of replicates.
![Figure 4. DDX58 KD reduces autophagy markers (A) HepG2 cells were treated with control siRNA, siMAVS, siIFIH1, and siDDX58, and treated with PA for 6 h. DDX58 knockdown showed a significant reduction in SQSTM1 levels. (B) qRT-PCR was done on three cell lines, control HepG2, siDDX58, and stable DDX58-overexpressing cells (DDX58 OE) to measure DDX58 gene expression as well as SQSTM1 gene expression. Cells were collected following a 6 h treatment with PA. Statistics were done using a students t-test (*P < 0.05; **P < 0.01; ***P < 0.001), error bars represent SEM. Black lines represent statistics performed for untreated cells between cell types, gray lines represent BSA vs. PA treatment within cell lines. (C) Immunoblots of HepG2 cells treated with control siRNA, siDDX58, and DDX58 OE were treated with 500 μM of PA for 24 h and in combination with PA and 30 uM chloroquine treatment. Immunoblots confirm DDX58 KD and DDX58 OE. DDX58 OE has undetectable amounts of SQSTM1 in PA treatment alone, and reduced levels of phosphorylated SQSTM1 (SQSTM1 [S403], and SQSTM1 [T269/S272]). Chloroquine treatment led to accumulation of p-SQSTM1 in siDDX58 and DDX58 OE but not unmodified SQSTM1. (D) Quantification of chloroquine-treated cells. Statistics were done using a two-way ANOVA followed by Bonferroni post hoc test (*P < 0.05; **P < 0.01; ***P < 0.001), error bars represent SEM. Black bars lines represent statistical analysis performed between BSA and PA treatment within a cell line, green lines represent changes with palmitic acid treatment between cell lines. Each experiment was done at least three times, images are representative of replicates.](/cms/asset/b7e253ea-7332-4c45-89d9-277be3f1b661/kaup_a_1920818_f0004_oc.jpg)
Figure 5. DDX58 KD increases apoptosis (A) HepG2 cell lines were treated with PA 500 μM and immunoblotting was performed to ensure knockdown and overexpression of DDX58. (B) TUNEL assay was performed to measure apoptosis following PA treatment. siDDX58 cells have increased TUNEL expression suggesting increased apoptosis compared to HepG2 control cells. DDX58 OE cells had no detectable TUNEL. Scale bar: 40 μm. (C) HepG2 cell lines (WT, siDDX58, and DDX58 OE, respectively) were treated with 500 μM PA and were co-stained with LipidSpotTM to visualize lipid droplets and LysoViewTM to label lysosome in live cells at 6, 24, and 96 h. All cell lines depict increase lipid staining with PA treatment. Scale bar: 20 μm. Each experiment was done at least three times.
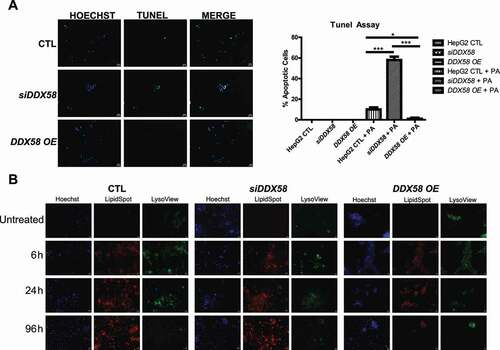
Figure 6. DDX58 OE promotes autophagy and degrades SQSTM1 preventing SQSTM1 inclusion bodies. (A) To measure DDX58 OEs autophagy response an autophagy kit was used to measure autophagosome formation seen in green. HepG2 cells treated with PA, chloroquine (CQ), rapamycin (RAP), and combination treatment of PA and CQ in both control HepG2 cells and DDX58 OE cells. Cells were labeled and analyzed by fluorescent microscopy. Green represents autophagosomes and blue represents Hoechst nuclear staining. Shown here are representative images from treatments. DDX58 OE cells have significantly more autophagosomes in comparison to control HepG2 cells. Scale bar: 20 μm. (B) Cells were plated in a 96 well plate, labeled, and fluorescence was quantified on a plate reader. Autophagosome fluorescence was normalized to total Hoechst nuclear staining emission. DDX58 OE cells have statistically significant increase in autophagosomes compared to control HepG2 cells without treatment and with palmitic acid treatment. Statistics were done using a students t-test (*P < 0.05; **P < 0.01; ***P < 0.001), error bars represent SEM. (C) To validate that DDX58 OE cells are more efficient at autophagic processes we looked at selective autophagy of SQSTM1 by measuring S403 phosphorylation and lysosomal marker LAMP1 colocalization. WT and DDX58 OE HepG2 cells were treated for 24 h with 500 μM PA and immunolabeling of p-SQSTM1 (S403) and LAMP1 was performed. Scale bar: 20 μm. (D) Colocalization was quantified using Pearson correlation coefficient on ImageJ using the plugin JACoP (Just Another Colocalization Plugin). Statistics were done using a Student’s t-test (*P < 0.05; **P < 0.01; ***P < 0.001), error bars represent SEM. (E) To measure SQSTM1 degradation cells were treated with 500 μM PA for 6 h followed by cycloheximide (CHX) treatment to block protein translation. Cells were collected 24 h post PA treatment. Immunoblotting was performed to measure DDX58, SQSTM1, and p-SQSTM (S403) and normalized to ACTB. (F) densitometry was performed and statistics were done using a Student’s t-test (*P < 0.05; **P < 0.01; ***P < 0.001), error bars represent SEM. Each experiment was done at least three times, images are representative of replicates.
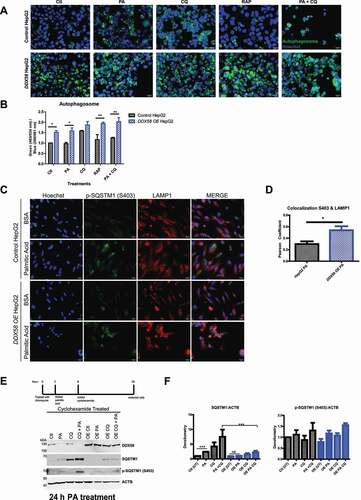
Figure 7. DDX58 overexpression reduced JAK-STAT inflammation (A) HepG2 cells were used as a control against a stable DDX58 OE HepG2 cell line. DDX58 OE HepG2 was developed from the control cells by transfection with pUNO-DDX58 plasmid from InvivoGen. Cells were treated with 500 μM PA for 24 h. Cell morphology shows HepG2 control cells are rounded and moving toward apoptosis whereas DDX58 OE cells were undisturbed by toxic levels of PA. Scale bar: 100 μm. (B) Lipid staining and lysosome staining were used to stain cells to validate PA uptake. Both cell lines took up PA and have comparable lysosome staining. Scale bar: 100 μm. (C) HepG2 cells were treated with 500 μM PA for 24 h and inflammatory pathways were examined by immunoblot. DDX58 OE cells significantly downregulate p-RELA, p-STAT1, and p-STAT3. (D) JAK- STAT peptide array was used as shown in Fig. S6 to characterize PA-induced inflammation. All values were normalized to positive controls. Statistical analysis used a two-way ANOVA followed by a Bonferroni post test to determine significance between groups. Grey horizontal lines compare Ctl vs. OE. Black horizontal lines depict PA treatments (Ctl + PA vs. DDX58 OE +PA). Green horizontal bars represent changes with PA treatment in HepG2 control cells alone (WT vs. WT +PA). Only significant changes were plotted for green horizontal lines. (*P < 0.05; **P < 0.01; ***P < 0.001), error bars represent SEM. Each experiment was done at least three times and representative images were chosen.
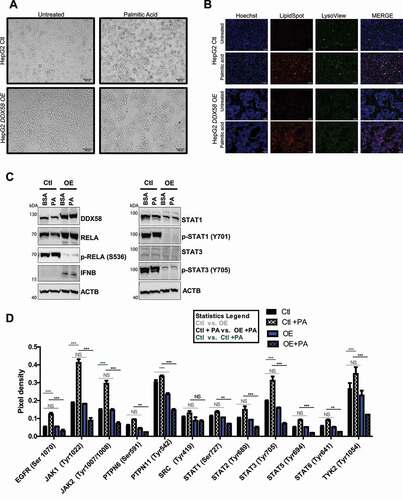
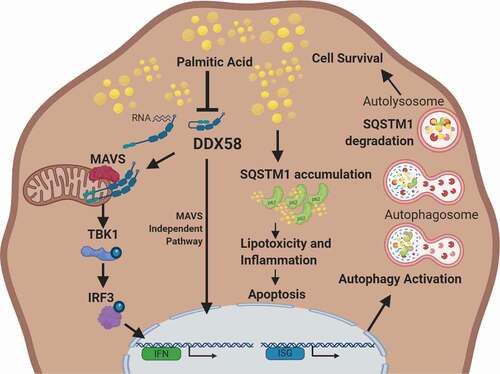
Figure 8. MODEL: DDX58 regulates autophagy in palmitic acid-induced lipotoxicity by controlling SQSTM1 expression and accumulation. DDX58 expression and activity are hindered by excessive lipids, however increasing DDX58 expression increases interferon signaling and this in turn activates autophagy. DDX58 regulates SQSTM1 expression and aids in selective autophagy to prevent SQSTM1 accumulation leading to Malloy-Denk bodies. This in turn limits inflammation associated with lipotoxicity and promotes cell survival. Model Created with BioRender.com.