
Figures & data
Figure 1. BECN2 negatively regulates inflammasome activation and IL1B production. (A and B) PMA pre-treated mCherry-EV and mCherry-BECN2 overexpressed THP-1 cells were primed with LPS (200 ng/ml) for 3 h, and then stimulated with nigericin (1 μM, 6 h), poly(dA:dT) (1 μg/ml, 6 h), anthrax lethal factor (LF) (1 μg/ml, 4–6 h), or flagellin (20 μg/ml, 6–8 h), respectively. IL1B production in supernatants (SN) was examined by ELISA (A). Protein levels of pro-CASP1 in whole cell lysates (WCL) and cleavage CASP1 in SN were detected using immunoblotting (B). (C and D) PMA pre-treated WT and BECN2 KO THP-1 cells were primed with LPS (200 ng/ml) for 3 h, and then stimulated with nigericin (1 μM, 6 h), poly(dA:dT) (1 μg/ml, 6 h), anthrax lethal factor (LF) (1 μg/ml, 4–6 h), flagellin (20 μg/ml, 6–8 h). IL1B production in SN was examined by ELISA (C). Protein levels of pro-CASP1 in WCL and cleavage of CASP1 in SN were detected using immunoblotting (D). WT and Becn2-deficient mouse BMDM (E and F), peritoneal neutrophils (G and H), and bone marrow-derived dendritic cells (BMDC) (I and J) were primed with LPS (100 ng/ml, 3 h), and then stimulated with nigericin (1 μM, 6 h), poly(dA:dT) (1 μg/ml, 6 h), anthrax lethal factor (LF) (1 μg/ml, 4–6 h), flagellin (20 μg/ml, 6–8 h). IL1B production in SN was examined by ELISA (E, G, I). Protein levels of pro-CASP1 in WCL and cleaved CASP1 in supernatants (SN) were detected using immunoblotting (F, H, J). *P < 0.05, **P < 0.01, ***P < 0.001. (Student’s t-test). Data are plotted as mean ± s.e.m. of three independent experiments.
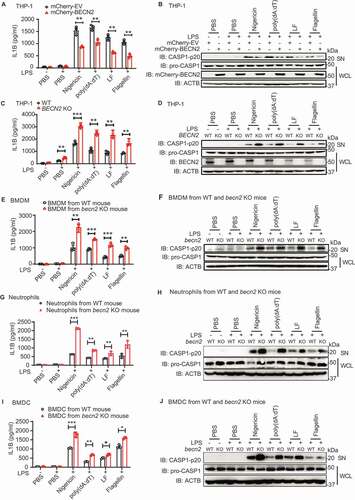
Figure 2. BECN2 interacts with inflammasome sensors through its CCDECD domain. (A) HEK293T cells were co-transfected with HA-tagged BECN2 and Flag-tagged EV, AIM2, NLRP1, NLRP3, NLRC4, PYCARD or CASP1. Cell lysates were immunoprecipitated with anti-Flag beads and immunoblotted using indicated antibodies. (B and C) THP-1 cells were left untreated or primed with LPS, then stimulated with poly(dA:dT) (1 μg/ml, 6 h) (B), or nigericin (1 μM, 6 h) (C). Cell lysates were immunoprecipitated using anti-NLRP3 or anti-AIM2 antibody and protein A/G beads and then immunoblotted using indicated antibodies. (D and E) HeLa cells co-transfected with GFP-BECN2 and Flag-AIM2 (D) or Flag-NLRP3 (E) were fixed and stained with anti-Flag antibody and the secondary antibody conjugated to Alexa Fluor 633. Colocalization was observed under confocal microscopy. Scale bar: 5 μm. (F) Schematic diagram of NLRP3 and domain truncation constructs. (G) HEK293T cells were co-transfected with Flag-tagged BECN2 and HA-tagged NLRP3 full-length or NLRP3 domain truncations. Cell lysates were immunoprecipitated with anti-Flag beads and immunoblotted using indicated antibodies. PYD, pyrin domain; LRR, leucine-rich repeat motif; NACHT, NOD or NBD-nucleotide-binding domain. (H) Schematic diagram of AIM2 and domain truncation constructs. (I) HEK293T cells were co-transfected with HA-tagged BECN2 and Flag-tagged AIM2 full-length or AIM2 domains, then immunoprecipitated using anti-Flag beads and immunoblotted using indicated antibodies. (J) Schematic diagram of BECN2 and domain truncation constructs. N, N-terminal domain; BH3 domain, BCL2 binding domain; CCD, central coiled-coil domain; and ECD, C-terminal evolutionarily conserved domain. (K and L) HA-tagged BECN2 full-length or domains were co-transfected with Flag-tagged AIM2 (K) or NLRP3 (L), followed by immunoprecipitation using anti-Flag beads and immunoblotted using indicated antibodies.
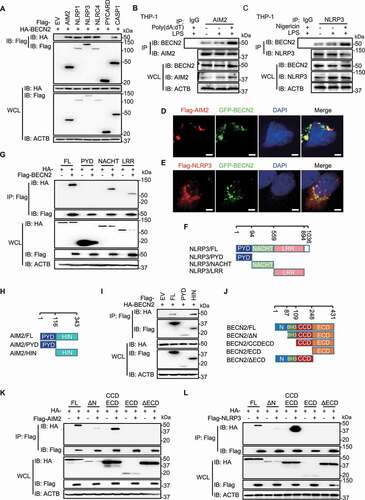
Figure 3. BECN2 degrades inflammasome sensors through the lysosomal pathway. (A) HEK293T cells were co-transfected with increasing doses of HA-tagged BECN2 plasmids along with Flag-tagged AIM2 or NLRP3, then immunoblotted using indicated antibodies. (B-D) WT and mCherry-BECN2-overexpressing THP-1 cells (B), or BECN2 KO THP-1 cells (C), and BMDMs from WT and Becn2-deficient mice (D) were left untreated or primed with LPS (200 ng/ml) for 3 h, then the protein levels of inflammasome sensors were detected by immunoblot using indicated antibodies. (E and F) HEK293T cells were co-transfected with HA-tagged BECN2 and Flag-tagged AIM2 (E) or NLRP3 (F), then treated with DMSO (vehicle), MG132, chloroquine (CQ) and bafilomycin A1 (Baf A1) for 6 h. Cell lysates were then immunoblotted using indicated antibodies. Quantification analysis for B-F is calculated based on the band density of three independent experiments after normalization. Statistical differences among inhibitor-treated groups were calculated using 1-way ANOVA with Tukey’s multiple comparison test (E, F). *P < 0.05, **P < 0.01, ***P < 0.001.
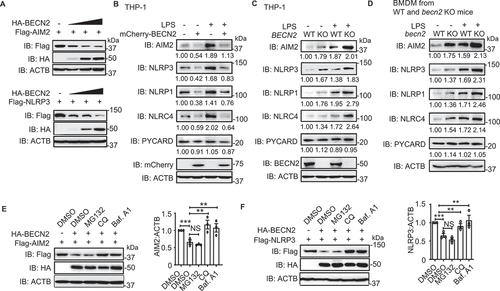
Figure 4. BECN2-mediated degradation of inflammasome sensors is through the ULK1/ATG9A-dependent but BECN1/ATG16L1/ATG7/LC3B-independent lysosomal pathway. (A-J) WT and autophagy gene KO HEK293T cells were co-transfected with HA-tagged BECN2 and Flag-tagged NLRP3 or AIM2. Protein levels of AIM2 and NLRP3 were immunoblotted using indicated antibodies in BECN1 KO cells (A and B), ATG16L1 and ATG7 KO cells (C and D), MAP1LC3B KO cells (E and F), ULK1 KO cells (G and H), and ATG9A KO cells (I and J). Quantification analysis is presented as mean ± s.e.m. and is calculated based on the band density of three independent experiments. Statistical differences between EmpVec-transfected and HA-BECN2-tranfected cells were calculated using Student’s unpaired t-test (A-J). Statistical differences between WT and KO groups were calculated using Student’s unpaired t-test (A, B, E, F) or 1-way ANOVA with Dunnett’s multiple comparison test (C, D, G-J). *P < 0.05, **P < 0.01, ***P < 0.001, ****P < 0.0001.
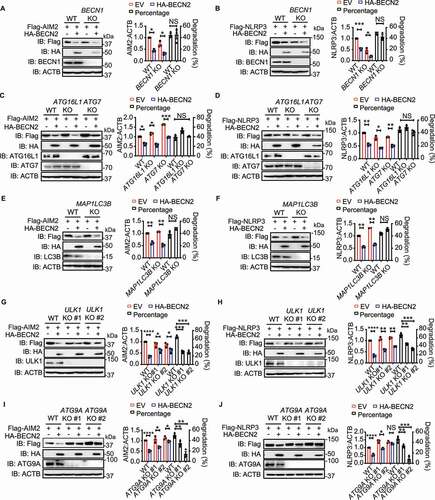
Figure 5. The interaction between BECN2 and inflammasome components requires ULK1 and ATG9A. (A and B) WT, ULK1 KO, and ATG9A KO HEK293T were co-transfected with HA-tagged BECN2 and Flag-tagged AIM2 (A) or NLRP3 (B), the cell lysates were immunoprecipitated with anti-Flag beads and then immunoblotted using indicated antibodies. (C) WT, ULK1 KO and ATG9A KO HEK293T cells co-transfected with GFP-AIM2 and mCherry-BECN2 were fixed with 4% (wt/vol) paraformaldehyde. Pearson’s correlation coefficient for colocalization was analyzed using Image J Coloc 2. Graph is plotted as mean ± s.e.m. (at least 30 cells were analyzed per condition). Representative images showing the colocalization were obtained using confocal microscopy. Scale bar: 5 μm. (D and E) WT, BECN2 KO, and ULK1 KO HEK293T were co-transfected with HA-tagged ATG9A and Flag-tagged AIM2 (D) or NLRP3 (E), the cell lysates were immunoprecipitated with anti-Flag beads and then immunoblotted using indicated antibodies. (F) WT and Becn2 KO BMDMs cells were left untreated or stimulated with LPS (200 ng/ml) for 3 h, the cell lysates were then immunoprecipitated using ATG9A antibodies, followed by immunoblotting with indicated antibodies. (G) WT and ULK1 KO HEK293T cells co-transfected with GFP-AIM2 and mCherry-ATG9A were fixed with 4% (wt/vol) paraformaldehyde. Pearson’s correlation coefficient for colocalization was analyzed using Image J Coloc 2. Graph represents mean ± s.e.m. (at least 30 cells were analyzed per condition). Representative images showing the colocalization were obtained using confocal microscopy. Scale bar: 5 μm. (H) WT and ULK1 KO HEK293T were co-transfected with Flag-tagged BECN2 and HA-tagged ATG9A, the cell lysates were immunoprecipitated with anti-Flag beads and then immunoblotted using indicated antibodies. Data are representative of at least three independent experiments. (I) WT and BECN2 KO 293T cells were transfected with AIM2-APEX2 encoding plasmid alone or along with Flag-BECN2. Representative EM images of cells expressing AIM2-APEX2 were processed in parallel under identical conditions. Black arrow indicates the AIM2 location. AP, autophagosome or amphisome; AL, autolysosome. Statistical differences between WT and KO groups were calculated using Student’s unpaired t-test (G) or 1-way ANOVA with Dunnett’s multiple comparison test (C). ***P < 0.001.
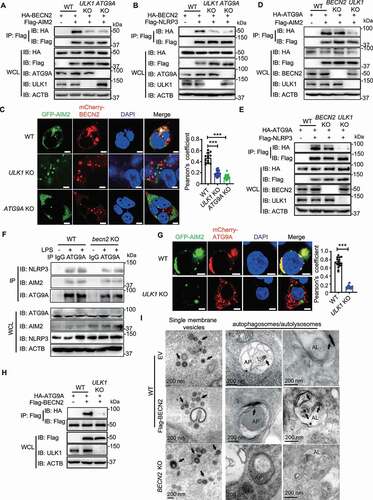
Figure 6. SEC22A, STX5, and STX6 are required for BECN2-mediated degradation of inflammasome components. (A and B) WT, SEC22A KO, STX5 KO, STX6 KO, and STX5:STX6 DKO HEK293T cells were co-transfected with HA-tagged BECN2 and Flag-tagged AIM2 (A) or NLRP3 (B). Protein levels of AIM2 and NLRP3 were immunoblotted using indicated antibodies. Quantification analysis is presented as mean ± s.e.m. and is calculated based on the band density of three independent experiments. (C) WT and BECN2 KO THP-1 cells were lysed and immunoprecipitated using ATG9A antibodies, followed by immunoblotting with indicated antibodies. Statistical differences between EmpVec-transfected and HA-BECN2-transfected cells were calculated using Student’s unpaired t-test (A and B). Statistical differences of degradation percentages between WT and KO groups were calculated using 1-way ANOVA with Dunnett’s multiple comparison test (A and B). *P < 0.05, **P < 0.01, ***P < 0.001, ****P < 0.0001. Data are mean ± s.e.m. of three independent experiments.
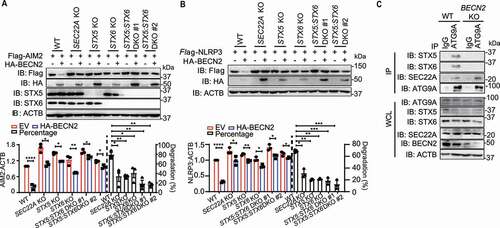
Figure 7. Loss of BECN2 exacerbates alum-induced peritoneal inflammation. (A, B) WT and becn2 KO mice were i.p. injected with alum (700 μg). The peritoneal exudate cells (PECs) were collected 12 h after injection. (A) Absolute numbers of PECs recruited to the peritoneum were counted (n = 4). (B) Protein levels of pro-CASP1 and inflammasome sensors in whole cell lysates (WCL) and cleaved CASP1 in SN of PECs at 12 h post-ex vivo culture was detected by immunoblot using indicated antibodies. (C-G) WT, becn2 KO and becn2: casp1 DKO mice were i.p. injected with alum (700 μg). IL1B production in peritoneal lavage obtained at 12 h post-injection was determined by ELISA (C). Data are mean ± s.e.m. of three independent experiments. Percentage of ITGAM+ LY6G+ neutrophils (D and E), monocytic (mMDSC, ITGAM+ LY6C1high LY6Glow) and granulocytic (gMDSC, ITGAM+ LY6C1int LY6Ghigh) subsets of myeloid-derived suppressor cells (F and G) recruited to the peritoneum were analyzed by flow cytometry. Statistical differences between groups were calculated using 1-way ANOVA with Tukey’s multiple comparison test. *P < 0.05, **P < 0.01, ***P < 0.001, ****P < 0.0001.
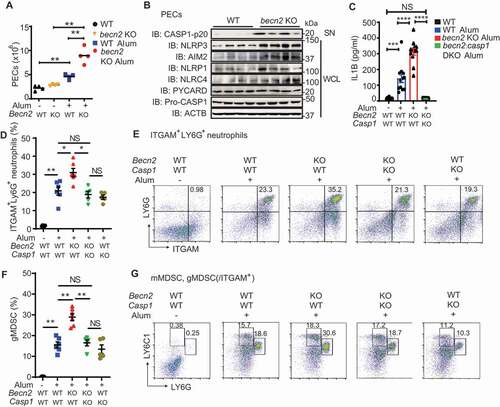
Table 1. Key resources table
Table 2. Sequences of primers used for constructing gene expression plasmids, related to Methods
Table 3. Design of the single-guide RNA sequence (sgRNA) for gene knockout by the Cas9-expression vector pLentiCRISPR-v2, related to Methods
Supplemental Material
Download Zip (2.2 MB)Data and materials availability
All data needed to evaluate the conclusions in the paper are present in the paper or the Supplementary Materials. Further information and requests for reagents should be directed to the Lead Contact, R.F.W. ([email protected]).