
Figures & data
Figure 1. HBV infection regulates CCDC88A expression and the vesicular trafficking system in the liver tissues of patients with HBV infection. The liver tissues of patients with HBV infection were fixed and stained, and then the expression levels of CCDC88A (A), the distribution of SHBsAg and HBcAg (B), the fluorescence intensity of the markers of ER (PDI), early endosome (RAB5A), and autophagosome (LC3) and the colocalization of these compartments with SHBsAg (C), the fluorescence intensity of SQSTM1 and the colocalization of SQSTM1 with SHBsAg or LC3 (D), and the colocalization of HBcAg with the markers of early endosome (RAB5A), late endosome (CD63), and autophagosome (LC3) (E) were evaluated by immunofluorescence. SmCl: HBsAgmiddle HBcAglow; ShCh: HBsAghigh HBcAghigh; SlCm: HBsAglow HBcAgmiddle; SnCn: HBsAgnegative HBcAgnegative. The fluorescence intensity of target proteins, and the colocalization between target proteins or with organelle marker proteins were analyzed using ImageJ software. The results presented in the graphs were calculated from at least 5 cells. Scale bar: 10 μm. *, #p < 0.05; **, ##p < 0.01; ***, ###p < 0.001; ns, not significant.
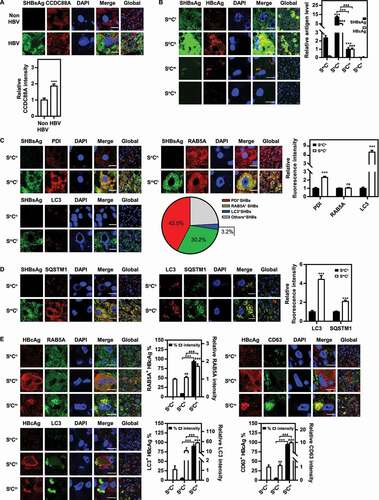
Figure 2. CCDC88A positively regulates HBV replication in hepatoma cells. Huh7 cells transiently transfected with pSM2 were transfected with siCCDC88A or siNC (A), or with the CCDC88A expression plasmid or empty vector (B), and harvested after 72 h. (C) HepG2.2.15 cells were transfected with siCCDC88A or siNC, and harvested after 72 h. The expression of CCDC88A, SHBsAg, and HBcAg was analyzed by western blotting, and ACTB was used as the loading control. The levels of HBsAg and HBeAg in the supernatants, the encapsidated HBV RIs, the levels of intracellular HBV DNA and that in the secreted virions were measured. (D) Huh7 cells were transiently cotransfected with pSM2 and siCCDC88A or siNC. The distribution of SHBsAg and HBcAg were assessed. (E and F) Huh7 cells were transfected with siCCDC88A or siNC, and the effects of CCDC88A knockdown on early endosome (RAB5A), late endosome (CD63) (E), and autophagic flux (LC3 puncta and SQSTM1 puncta) (F) were assessed. The fluorescence intensity of RAB5A, CD63, LC3, and SQSTM1 were analyzed using ImageJ software. The intracellular distribution of SHBsAg and HBcAg was analyzed by determining their intensity profiles along the white arrows using ImageJ software. The results presented in the graphs were calculated from at least 5 cells. (G) Huh7 cells were transfected with siCCDC88A or siNC, and harvested after 48 h. The expression of LC3B and SQSTM1 were measured by western blotting. Scale bar: 10 μm. *p < 0.05; **p < 0.01; ***p < 0.001; ns, not significant.
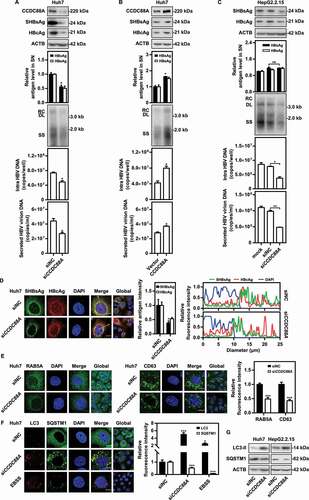
Figure 3. DNM2 or CLTC silencing inhibits HBV replication by blocking endosome formation. (A) Huh7 cells were transfected with siDNM2 or siCLTC and harvested after 48 h. The expression of RAB5A and CD63 was assessed. Scale bar: 10 μm. The fluorescence intensity of RAB5A and CD63 were analyzed using ImageJ software. The results presented in the graphs were calculated from at least 5 cells. (B) Huh7 cells transiently transfected with pSM2 or (C) HepG2.2.15 cells were transfected with siDNM2 or siCLTC, and harvested after 72 h. The expression of DNM2, CLTC, SHBsAg, and HBcAg, the levels of HBsAg and HBeAg in the supernatants, the encapsidated HBV RIs, the levels of intracellular HBV DNA and that in the supernatants, and the HBV RNA levels were measured. (D) Huh7 cells were cotransfected with siDNM2 or siCLTC and pSM2, and harvested after 72 h. The distribution of SHBsAg and HBcAg was assessed. Scale bar: 10 μm. The fluorescence intensity of SHBsAg and HBcAg were analyzed using ImageJ software. The intracellular distribution of SHBsAg and HBcAg was analyzed by determining their intensity profiles along the white arrows using ImageJ software. The results presented in the graphs were calculated from at least 5 cells. (E and F) Huh7 cells transiently transfected with pSM2 were cotransfected with siDNM2 or siCLTC, and the CCDC88A expression plasmid or empty vector (E), or siRAB5A and the CCDC88A expression plasmid or empty vector (F), harvested after 72 h. The levels of HBsAg and HBeAg in the supernatants and that in the intracellular were quantified. *p < 0.05; **p < 0.01; ***p < 0.001; ns, not significant.
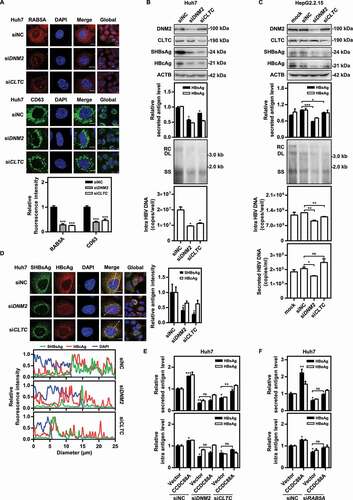
Figure 4. Inhibition of DNM2 by dynasore suppresses HBV replication. (A) Huh7 cells were transfected with pSM2, and treated with dynasore (20 μM) and harvested after 48 h. RAB5A expression was evaluated. Scale bar: 10 μm. The fluorescence intensity of RAB5A was analyzed using ImageJ software. The results presented in the graphs were calculated from at least 5 cells. (B) Huh7 cells transfected with pSM2 and HepG2.2.15 cells were treated with dynasore (5, 10, 15, and 20 μM), and harvested after 72 h. The levels of HBsAg and HBeAg in the supernatants were quantified. (C) Huh7 cells transiently transfected with pSM2 or (D) HepG2.2.15 cells were treated with dynasore (20 μM) and harvested after 72 h. The expression of SHBsAg and HBcAg, the encapsidated HBV RIs, the levels of intracellular HBV DNA, and the HBV RNA levels were measured. (E) Huh7 cells transfected with pSM2 and HepG2.2.15 cells were treated with dynasore (20 μM), and harvested after 48 h. The distribution of SHBsAg and HBcAg was assessed. Scale bar: 10 μm. The fluorescence intensity of SHBsAg and HBcAg were analyzed using ImageJ software. The results presented in the graphs were calculated from at least 5 cells. (F) Huh7 cells were cotransfected with pSM2 and the CCDC88A expression plasmid or empty vector, and treated with dynasore (20 μM), and harvested after 72 h. The expression of SHBsAg and HBcAg, and the levels of HBsAg and HBeAg in the supernatants were analyzed. *p < 0.05; **p < 0.01; ***p < 0.001; ns, not significant.
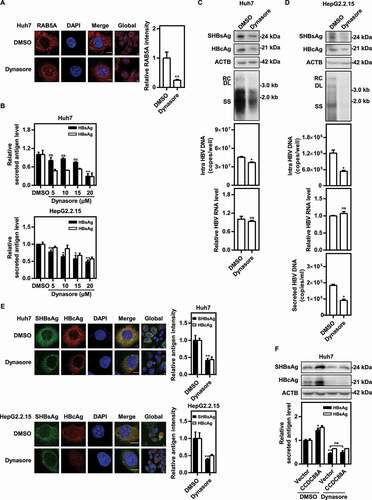
Figure 5. CCDC88A or DNM2 silencing reduces colocalization of SHBsAg with early endosomes and prevents core particles from entering MVBs. Huh7 cells were cotransfected with pSM2, with (A) or without (B) RAB5A-EGFP plasmids for 48 h. (C) Huh7 cells were cotransfected with pSM2 and siCCDC88A or siDNM2 for 48 h. The colocalization of SHBsAg with RAB5A was imaged. Scale bar: 10 μm. (D) Huh7 cells were cotransfected with pSM2 and siCCDC88A or siDNM2 for 48 h. (E) Huh7 cells were transfected with HBV deletion mutant plasmids, including LHBsAg−, MHBsAg−, SHBsAg−, L/MHBsAg− and AllHBsAg− plasmids for 48 h. The colocalization of HBcAg and CD63 was measured. Scale bar: 10 μm. The fluorescence intensity of target proteins, and the colocalization between target proteins or with organelle marker proteins were analyzed using ImageJ software. The results presented in the graphs were calculated from at least 5 cells. (F) Huh7 cells were transfected with the HBV wild-type (WT) and HBV deletion mutant plasmids, including LHBsAg−, MHBsAg−, SHBsAg−, L/MHBsAg− and AllHBsAg− plasmids, for 72 h. The HBV gene expression and replication were analyzed. (G) Huh7 cells were transfected with the HBV WT plasmid or cotransfected with the HBV deletion mutant plasmid SHBsAg−, and HA-SHBsAg, HA-pol or empty vector for 48 h. The expression of HBcAg and SHBsAg or HA was detected. Scale bar: 10 μm. *, #p < 0.05; **, ##p < 0.01; ***p < 0.001; ns, not significant.
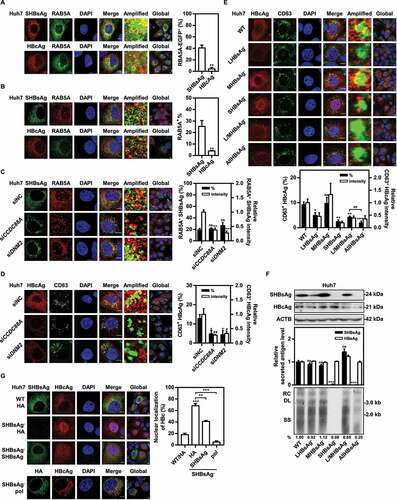
Figure 6. CCDC88A or DNM2 silencing causes SHBsAg accumulation on the ER lumen, thereby triggering ER stress. Huh7 cells were cotransfected with pSM2 combined without (A) or with (B) DsRed-ER plasmid, and siCCDC88A or siDNM2 for 48 h. The colocalization of SHBsAg and ER was imaged. Scale bar: 10 μm. The colocalization between SHBsAg and ER was analyzed using ImageJ software. The results presented in the graphs were calculated from at least 5 cells. (C) Huh7 cells were cotransfected with pSM2 or empty plasmid pUC19, and siCCDC88A or siDNM2 for 48 h. HepG2.2.15 cells were transfected with siCCDC88A or siDNM2 (D) or treated with dynasore (E) for 48 h. The expression levels of HSPA5, EIF2A, p-EIF2A, ERN1, p-ERN1 and ATF6 were measured.
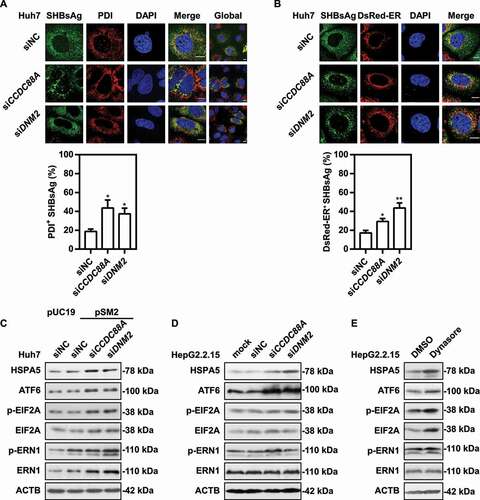
Figure 7. CCDC88A or DNM2 silencing leads to increased autophagic flux and HBV antigens degradation. (A) Huh7 cells were cotransfected with pSM2 and siCCDC88A or siDNM2 for 48 h. The colocalization of SHBsAg and LC3 was imaged. Scale bar: 10 μm. (B) HepG2.2.15 cells were transfected with siCCDC88A, and then treated with 10 μM CQ, and harvested after 72 h. The expression of SHBsAg, HBcAg, LC3 and SQSTM1 (upper) and the levels of HBsAg and HBeAg in the supernatants (below) were quantified. (C) Huh7 cells were cotransfected with pSM2 or empty plasmid pUC19 and siCCDC88A or siDNM2, and harvested after 48 h and then incubated with DQ-BSA Red for 30 min. The fluorescent signal of DQ-BSA Red produced by autolysosomal proteolysis was evaluated. Scale bar: 10 μm. (D) Huh7 cells were cotransfected with the mCherry-GFP-LC3 plasmid and siCCDC88A or siDNM2, and harvested after 48 h. The mCherry and GFP signals were examined by confocal microscopy. Scale bar: 10 μm. (E and F) Huh7 cells were cotransfected with pSM2 and siCCDC88A or siDNM2. The fluorescence intensity of LysoTracker Red (E) or AO (F) were analyzed. Scale bar: 10 μm. The fluorescence intensity of target proteins, and the colocalization between target proteins or with organelle marker proteins were analyzed using ImageJ software. The results presented in the graphs were calculated from at least 5 cells. *, #p < 0.05; **p < 0.01; ***p < 0.001; ns, not significant.
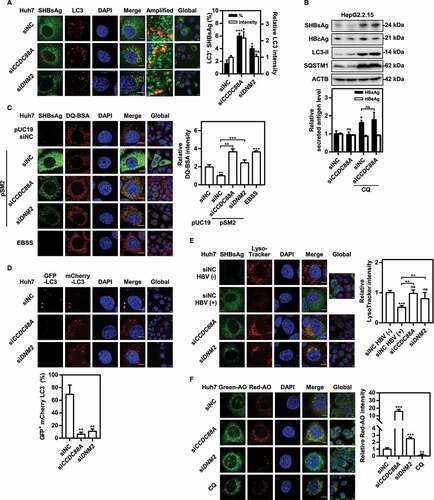
Figure 8. Silencing either CCDC88A or its other effector GNAI3 contributes to autophagic flux, but CCDC88A silencing and GNAI3 silencing have opposite effects on HBV replication. (A) Huh7 cells transiently transfected with pSM2 or (B) HepG2.2.15 cells were transfected with siCCDC88A or siGNAI3, and harvested after 72 h. The expression levels of CCDC88A, GNAI3, AKT, p-AKT, MTOR, p-MTOR, LC3 and SQSTM1 were evaluated. (C) Huh7 cells transiently transfected with pSM2 or (D) HepG2.2.15 cells were transfected with siGNAI3 or siNC, and harvested after 72 h. The HBV gene expression and replication were measured. (E) Huh7 cells were cotransfected with pSM2 and siGNAI3 or siNC, and harvested after 72 h. The expression of SHBsAg and HBcAg was evaluated. Scale bar: 10 μm. The fluorescence intensity of SHBsAg and HBcAg were analyzed using ImageJ software. The results presented in the graphs were calculated from at least 5 cells. (F) Huh7 cells were cotransfected with pSM2 and siGNAI3; then, the cells were cultured with 0.2% FBS and treated with 10 μM insulin, and harvested after 72 h. The expression of HBsAg and HBeAg was analyzed. (G and H) Huh7 cells were transfected with the WT CCDC88A plasmid or CCDC88AF1685A plasmid (a plasmid expressing a GNAI3 binding-inactivated CCDC88A mutant) for 72 h. The expression levels of CCDC88A, AKT, p-AKT, MTOR, p-MTOR, LC3 and SQSTM1 (G) and the HBV gene expression and replication (H) were analyzed. (I) Huh7 cells were transfected with the WT CCDC88A plasmid or CCDC88AF1685A plasmid, and then cultured with 0.2% FBS and treated with 10 μM insulin for 72 h. The expression of HBsAg and HBeAg was analyzed. *p < 0.05; **p < 0.01; ***p < 0.001; ns, not significant.
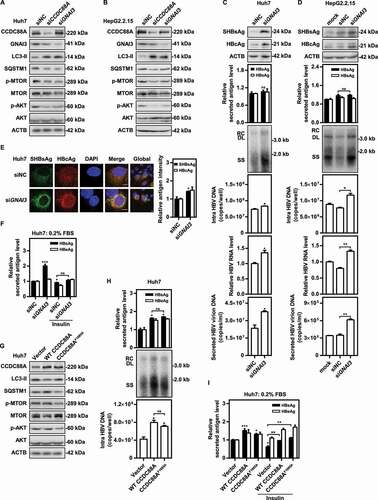
Figure 9. Model of CCDC88A-mediated regulation of HBV replication. CCDC88A overexpression (upper) promotes endosome formation to increase HBV replication and secretion. In addition, CCDC88A overexpression decreases lysosomal activity to prevent degradation of HBV antigens by upregulating AKT-MTOR signaling. In contrast, silencing CCDC88A (bottom) can prevent endosome formation and promote HBV antigen degradation by enhancing lysosomal activity and autophagic flux, thereby inhibiting HBV replication. In addition, silencing CCDC88A did not affect the fusion of autophagosome-lysosome, and restored the lysosomal activity and maturation inhibited by HBV infection, resulting in decreased HBV replication and secretion. CCP, clathrin-coated pit; INSR, insulin receptor.
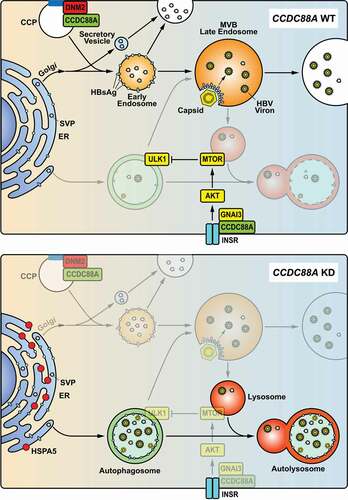
Table 1. List of antibodies