
Figures & data
Figure 1. Autophagy is triggered not only by nitrogen starvation, but also by depletion of sulfur, phosphorus of carbon sources. (A) GFP-Atg8 cleavage is caused by nitrogen, sulfur or phosphorus starvation. MM cultures from the wild-type strain CC10, expressing GFP-Atg8 under the control of the constitutive sty1 promoter from an integrative plasmid, were collected at the logarithmic phase (-) and 4-8-24 h after switching cells to media without nitrogen (w/o N), sulfur (w/o S) or phosphorus (w/o P) sources. Native extracts were analyzed by western blot using anti-GFP antibody. Ponceau staining of the membrane after immuno-detection is shown as a loading control. Numbers below the panels represent the amount of cleaved GFP (quantified as indicated in Materials and Methods) relative to cleaved GFP after 4 h without nitrogen (with an assigned value of 1). (B) GFP-Atg8 cleavage is also induced by glucose exhaustion. The wild-type strain CC10 was grown in standard YE5S (3% glucose) and modified YE5S (1% glucose). Cells were collected at the logarithmic phase and at the indicated times after reaching an OD600 of 0.5. For glucose-starvation in YE5S 0.08% of glucose, cells were switched at the logarithmic phase from standard YE5S (3%) to YE5S 0.08%. Samples were treated and analyzed as in (A). Numbers below the panels represent the amount of cleaved GFP relative to the amount after 1 day in standard YE5S (3%) (with an assigned value of 1). (C) Scheme of the different cellular pathways studied in this work, related to sensing and responding to nitrogen and glucose deprivation in fission yeast. See text for details.
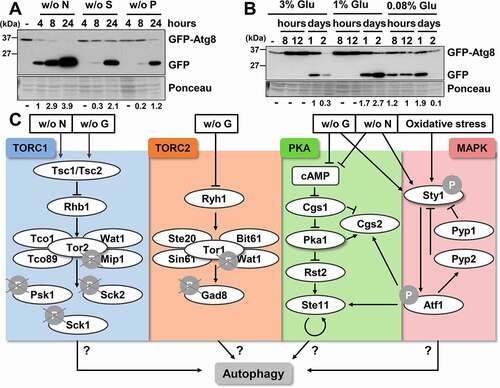
Figure 2. TORC1 negatively regulates autophagy. (A) TORC1 kinase activity and phosphorylation of its downstream consecutive targets, Psk1 and Rps6, are inhibited upon nutrient deprivation. MM cultures of strain CC10 (expressing GFP-Atg8) were collected at the logarithmic phase (-) and 30 min or 8 h after switching to modified MM with low glucose (0.08% Gluc), or without nitrogen (- N), sulfur (- S), and phosphorus (- P) sources. TCA extracts were analyzed by western blot with anti-phospho-Psk1 (anti-RPS6KB/p70) and anti-phospho-Rps6 (anti-AKT) antibodies. (B) Effect of TORC1 pathway mutants on the inhibition of Psk1 and Rsp6 phosphorylation after nitrogen depletion. MM cultures of strains CC10 (WT), JUP1350 (tor2L1310P), CC31 (tsc1Δ tsc2Δ), CC18 (tco89Δ) and CC21 (sck2Δ) were shifted to nitrogen depleted media for 10–30 min and analyzed as in (A). (C) Effect of TORC1 pathway mutants on autophagy activation upon nitrogen depletion. MM cultures of strains CC10 (WT), CC14 (tsc1Δ), CC31 (tsc1Δ tsc2Δ), CC18 (tco89Δ), CC66 (psk1Δ), CC89 (sck1Δ) and CC21 (sck2Δ), all expressing GFP-Atg8, were shifted or not at the logarithmic phase (unt) to nitrogen-free medium for 1–3 h, and were processed and analyzed as in . Accelerated GFP-Atg8 cleavage is indicated with green circles, while deficient cleavage is labeled with a red circle. Numbers below the panels represent the amount of cleaved GFP relative to the amount after 2 h without nitrogen in WT (with an assigned value of 1). (D) Atg1 dephosphorylation after nitrogen depletion is defective in tor2L1310P and tsc1Δ mutants. MM cultures of strains CC99 (WT), CC115 (tor2L1310P), CC101 (tsc1Δ), RB15 (tco89Δ), RB5 (psk1Δ), RB13 (sck1Δ), and RB6 (sck2Δ), all expressing Atg1-HA, were shifted or not to nitrogen-free medium, and processed and analyzed as in (A), using anti-HA antibody. (E) Scheme depicting the nutrient depletion-dependent antagonistic regulation by TORC1 pathway of growth-related functions and of autophagy. Deletion or point mutants used in this study are represented in red (low autophagy) and green (high autophagy). See text for details.
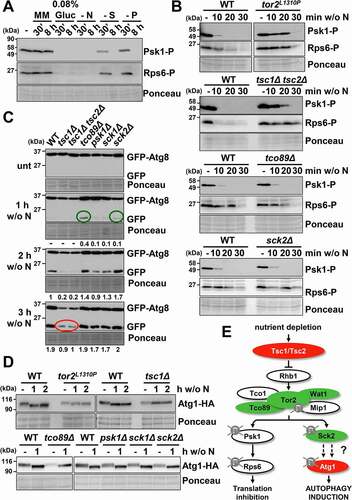
Figure 3. TORC2 interacts with TORC1 under basal condition and affects autophagy activation. (A) Inhibition of TORC2 kinase activity by glucose, but not nitrogen, depletion causes Gad8 dephosphorylation. MM cultures of strain AN0175 (WT), expressing Gad8-HA, were shifted or not to nitrogen-free or glucose-free medium, and processed and analyzed as in , using anti-HA antibody. (B) Effect of TORC2 pathway mutants on the inhibition of Psk1 and Rsp6 phosphorylation, downstream of TORC1, after nitrogen depletion. MM cultures of strains AN0179 (WT), RB17 (tor1Δ) and RB18 (gad8Δ), all expressing Psk1-Myc, were shifted or not to nitrogen depleted media for 10–30 min and analyzed as in . Anti-Myc was used as a loading control to demonstrate that Psk1 phosphorylation but not Psk1 levels are altered in the TORC2 mutants (Psk1). (C) Effect of TORC2 pathway mutants on autophagy activation upon nitrogen depletion. MM cultures of strains CC10 (WT), CC92 (wat1Δ), CC70 (gad8Δ), CC16 (tor1Δ) and RB4 (gad8Δ tor1Δ), all expressing GFP-Atg8, were shifted or not to nitrogen-free medium, and processed and analyzed as in . Numbers below the panels represent the amount of cleaved GFP relative to the amount after 2 h without nitrogen in WT (with an assigned value of 1). (D) Atg1 dephosphorylation after nitrogen depletion is unaffected in strain gad8Δ. MM cultures of strains CC99 (WT) and CC116 (gad8Δ), both expressing Atg1-HA, were shifted or not to nitrogen-free medium, and processed and analyzed as in . (E) Synthetic interaction between TORC1 and TORC2 mutants on TORC1 kinase activity. MM cultures of strains CC10 (WT), CC70 (gad8Δ), CC128 (tor2L1310P gad8Δ) and JUP1350 (tor2L1310P) were shifted or not to nitrogen-free medium, and processed and analyzed as in . (F) Synthetic interaction between TORC1 and TORC2 mutants on autophagy. MM cultures of strains CC10 (WT), CC70 (gad8Δ), RB32 (tor2L1310P gad8Δ) and CC112 (tor2L1310P), all expressing GFP-Atg8, were shifted or not to nitrogen-free medium, and processed and analyzed as in . Numbers below the panels represent the amount of cleaved GFP relative to the amount after 2 h without nitrogen in WT (with an assigned value of 1). (G) Scheme depicting the positive regulation of TORC1 kinase activity by the TORC2 components Tor1 and Gad8 under nutrient-rich conditions. Deletion or point mutants used in this study are represented in red (low autophagy) and green (high autophagy). See text for details.
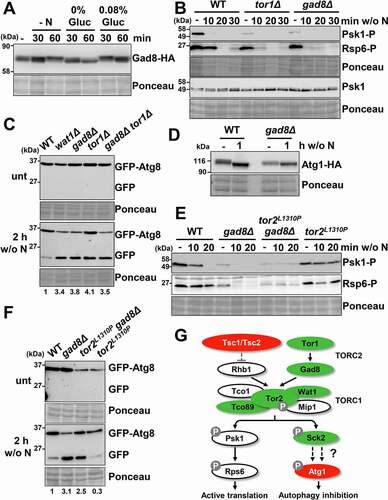
Figure 4. Comparative regulation of autophagy through the TORC1, TORC2 and MAP kinase pathways. (A) Effect of TORC1, TORC2, PKA and MAP kinase pathway mutants on autophagy activation upon nitrogen depletion. MM cultures of strains CC10 (WT), CC31 (tsc1Δ tsc2Δ), CC18 (tco89Δ), CC21 (sck2Δ), CC66 (psk1Δ), CC16 (tor1Δ), CC33 (cgs1Δ), CC22 (pka1Δ), CC13 (sty1Δ) and CC23 (atf1Δ), all expressing GFP-Atg8, were shifted or not at the logarithmic phase (unt) to nitrogen-free medium for 1–3 h, and were processed and analyzed as in . Accelerated GFP-Atg8 cleavage is indicated with green circles, while deficient cleavage is labeled with red circles. Numbers below the panels represent the amount of cleaved GFP relative to the amount after 2 h without nitrogen in WT (with an assigned value of 1). (B) Effect of TORC1, TORC2 and MAP kinase pathway mutants on autophagy activation upon depletion of the glucose, sulfur or phosphorus sources. MM cultures of strains CC10 (WT), CC31 (tsc1Δ tsc2Δ), CC18 (tco89Δ), CC21 (sck2Δ) CC16 (tor1Δ), CC70 (gad8Δ) and CC13 (sty1Δ), all expressing GFP-Atg8, were shifted at the logarithmic phase (unt) to modified MM with low glucose (0.08% Gluc), or without sulfur (w/o S) or phosphorus (w/o P) sources for 8 h, and were processed and analyzed as in . A sample of extracts from CC10 (WT) after 2 h of nitrogen-starvation was used as an autophagy control. Numbers below the panels represent the amount of cleaved GFP relative to the amount in WT after 8 h under indicated conditions (0.08% Gluc, without [w/o] S and without [w/o] P) (with assigned values of 1). (C) Effect of TORC1, TORC2 and MAP kinase pathway mutants on bulk autophagy activation upon nitrogen depletion. MM cultures of strains RB44 (WT), RB40 (atg1Δ), RB45 (tsc1Δ), RB41 (tor2L1310P), RB48 (tco89Δ), RB39 (gad8Δ) and RB38 (sty1Δ), all expressing Pgk1-GFP, were shifted or not at the logarithmic phase (unt) to nitrogen-free medium for 1–2 h, and were processed and analyzed as in . Numbers below the panels represent the amount of cleaved GFP relative to the amount in WT after 1 h under nitrogen deprivation (with an assigned value of 1). (D) Effect of TORC1, TORC2 and MAP kinase pathway mutants on bulk autophagy activation upon depletion of the glucose, sulfur or phosphorus sources. MM cultures of strains strains RB44 (WT), RB40 (atg1Δ), RB45 (tsc1Δ), RB41 (tor2L1310P), RB48 (tco89Δ), RB39 (gad8Δ) and RB38 (sty1Δ), all expressing Pgk1-GFP, were shifted at the logarithmic phase (unt) to modified MM with low glucose (0.08% Gluc), or without sulfur (w/o S) or phosphorus (w/o P) sources for 8 h, and were processed and analyzed as in . Numbers below the panels represent the amount of cleaved GFP relative to the amount in WT after 8 h under each condition (0.08% Gluc, without [w/o] S and without [w/o] P) (with assigned values of 1). (E) Scheme depicting the impact of mutations at the TORC1, TORC2 or MAP kinase pathways on autophagy induction. Accelerated nutrient starvation-dependent autophagy of some mutants is indicated in green, while deficient autophagy is indicated in red. See text for details.
![Figure 4. Comparative regulation of autophagy through the TORC1, TORC2 and MAP kinase pathways. (A) Effect of TORC1, TORC2, PKA and MAP kinase pathway mutants on autophagy activation upon nitrogen depletion. MM cultures of strains CC10 (WT), CC31 (tsc1Δ tsc2Δ), CC18 (tco89Δ), CC21 (sck2Δ), CC66 (psk1Δ), CC16 (tor1Δ), CC33 (cgs1Δ), CC22 (pka1Δ), CC13 (sty1Δ) and CC23 (atf1Δ), all expressing GFP-Atg8, were shifted or not at the logarithmic phase (unt) to nitrogen-free medium for 1–3 h, and were processed and analyzed as in Figure 1A. Accelerated GFP-Atg8 cleavage is indicated with green circles, while deficient cleavage is labeled with red circles. Numbers below the panels represent the amount of cleaved GFP relative to the amount after 2 h without nitrogen in WT (with an assigned value of 1). (B) Effect of TORC1, TORC2 and MAP kinase pathway mutants on autophagy activation upon depletion of the glucose, sulfur or phosphorus sources. MM cultures of strains CC10 (WT), CC31 (tsc1Δ tsc2Δ), CC18 (tco89Δ), CC21 (sck2Δ) CC16 (tor1Δ), CC70 (gad8Δ) and CC13 (sty1Δ), all expressing GFP-Atg8, were shifted at the logarithmic phase (unt) to modified MM with low glucose (0.08% Gluc), or without sulfur (w/o S) or phosphorus (w/o P) sources for 8 h, and were processed and analyzed as in Figure 1A. A sample of extracts from CC10 (WT) after 2 h of nitrogen-starvation was used as an autophagy control. Numbers below the panels represent the amount of cleaved GFP relative to the amount in WT after 8 h under indicated conditions (0.08% Gluc, without [w/o] S and without [w/o] P) (with assigned values of 1). (C) Effect of TORC1, TORC2 and MAP kinase pathway mutants on bulk autophagy activation upon nitrogen depletion. MM cultures of strains RB44 (WT), RB40 (atg1Δ), RB45 (tsc1Δ), RB41 (tor2L1310P), RB48 (tco89Δ), RB39 (gad8Δ) and RB38 (sty1Δ), all expressing Pgk1-GFP, were shifted or not at the logarithmic phase (unt) to nitrogen-free medium for 1–2 h, and were processed and analyzed as in Figure 1A. Numbers below the panels represent the amount of cleaved GFP relative to the amount in WT after 1 h under nitrogen deprivation (with an assigned value of 1). (D) Effect of TORC1, TORC2 and MAP kinase pathway mutants on bulk autophagy activation upon depletion of the glucose, sulfur or phosphorus sources. MM cultures of strains strains RB44 (WT), RB40 (atg1Δ), RB45 (tsc1Δ), RB41 (tor2L1310P), RB48 (tco89Δ), RB39 (gad8Δ) and RB38 (sty1Δ), all expressing Pgk1-GFP, were shifted at the logarithmic phase (unt) to modified MM with low glucose (0.08% Gluc), or without sulfur (w/o S) or phosphorus (w/o P) sources for 8 h, and were processed and analyzed as in Figure 1A. Numbers below the panels represent the amount of cleaved GFP relative to the amount in WT after 8 h under each condition (0.08% Gluc, without [w/o] S and without [w/o] P) (with assigned values of 1). (E) Scheme depicting the impact of mutations at the TORC1, TORC2 or MAP kinase pathways on autophagy induction. Accelerated nutrient starvation-dependent autophagy of some mutants is indicated in green, while deficient autophagy is indicated in red. See text for details.](/cms/asset/624a8212-070f-45e9-804a-8f35bfd4f043/kaup_a_1935522_f0004_oc.jpg)
Figure 5. The MAP kinase Sty1 does not regulate TORC1-dependent growth promotion functions, nor affects phosphorylation levels of Atg1 and Atg2, but positively regulates autophagy. (A) Sty1 is phosphorylated upon nitrogen or glucose starvation. MM cultures of wild-type strain CC10 were grown and shifted or not from the logarithmic phase (-) to modified MM without nitrogen (w/o N) or with low glucose (0.08%). As a control, logarithmic cultures were treated 10 min with 1 mM H2O2. TCA extracts were analyzed by western blot using anti-phospho-MAPK/p38 (Sty1-P) and anti-Sty1 antibodies. (B) Lack of Sty1 does not impair dephosphorylation of Psk1 and Rsp6 after nitrogen depletion. MM cultures of strains CC10 (WT) and CC13 (sty1Δ) were shifted or not to nitrogen depleted media for 10–30 min and analyzed as in . (C) Synergistic role of TORC1 and MAP kinase pathways on autophagy activation. MM cultures of strains CC10 (WT), CC14 (tsc1Δ), CC13 (sty1Δ) and CC111 (tsc1Δ sty1Δ), all expressing GFP-Atg8, were shifted or not to nitrogen-free medium for 2–7 h, and processed and analyzed as in Figure 2 C. Numbers below the panels represent the amount of cleaved GFP relative to the amount after 2 h without nitrogen in WT (with an assigned value of 1). (D) Lack of Sty1 does not impair dephosphorylation of Atg1 after nitrogen depletion. MM cultures of strains CC99 (WT) and CC110 (sty1Δ), both expressing Atg1-HA, were shifted or not to nitrogen depleted media for 1–2 h and analyzed as in Figure 2A, using anti-HA antibody. Numbers below the panels represent the amount of Atg1 relative to the amount in WT under physiological conditions (-) (with an assigned value of 1). (E) Lack of Sty1 does not impair phosphorylation of Atg2 after nitrogen depletion. MM cultures of strains CC122 (WT) and CC123 (sty1Δ), both expressing Atg2-HA, were shifted or not to nitrogen depleted media for 1–2 h and analyzed as in , using anti-HA antibody.
Figure 6. Sty1 plays a role in transcriptional upregulation of atg genes after nitrogen starvation. (A) Expression of some atg genes is dependent on Sty1. MM cultures of strains CC10 (WT), CC14 (tsc1Δ), CC13 (sty1Δ) and CC111 (tsc1Δ sty1Δ) were collected at the logarithmic phase (unt) and 2 h after switching to nitrogen-starved medium; total RNA was isolated and the transcripts specific for atg1, atg4, atg6, atg9, atg22 and atg13 were quantified by RT-qPCR. Amplification with tfb2 primers was used as a normalization control. Each column represents the mean value and SD (standard deviation), calculated from four biological replicates. Asterisks represent significant differences, *p˂0.01 (Welch’s t-test). (B) Scheme suggesting that Sty1 does not induce autophagy through a direct effect on Atg13-Atg1-Atg2 phosphorylation levels, but rather through the transcriptional upregulation of atg genes. See text for details.
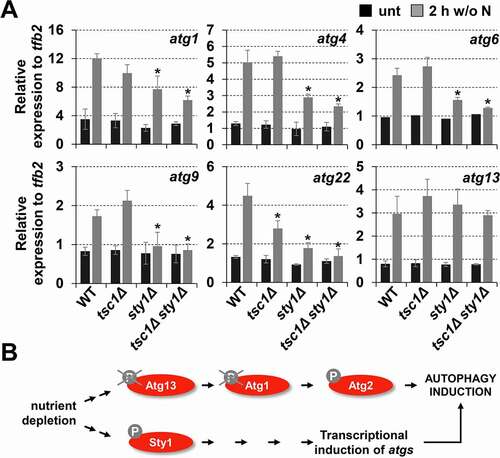
Figure 7. Biological role of autophagy in cells auxotrophic for leucine. (A) The negative effect on lifespan of atg mutants can only be observed 25 days after nutrient deprivation. MM cultures of strains CC10 (WT), CC11 (atg1Δ) and CC20 (atg2Δ) grown in MM until logarithmic phase (day 0) were switched to modified MM without nitrogen (w/o N), sulfur (w/o S) or phosphorus (w/o P) sources during 25 days. Serial dilutions of the cultures were plated onto YE5S plates. (B) The negative effect on lifespan of atg mutants auxotrophic for leucine can be observed 12 h after nitrogen or leucine deprivation. Strains HM123 (WT) and SK1 (atg1Δ), both carrying the leu1-32 allele, were grown in leucine-supplemented MM until logarithmic phase (day 0) and switched to MM without leucine (MM), MM with leucine (MM +Leu), MM without nitrogen (w/o N) or MM without nitrogen with leucine (w/o N +Leu), for 12 or 24 h. Serial dilutions of the cultures were plated onto YE5S plates. (C, D) Microscopy images (C) and percent of survival (D) of HM123 (WT leu1-32) and SK1 (atg1Δ leu1-32) after 48 h in MM and leucine-supplemented MM (+ Leu). For survival measurements, cells were incubated with the permeability-dependent dye PI, and the percentage of non-fluorescent cells, indicative of viability, was determined by flow cytometry. (E) TORC1 kinase activity is unaffected in an autophagy-proficient leu1-32 background. MM cultures of strains CC10 (WT) and CC88 (WT leu1-32) were shifted or not to nitrogen depleted media for 10–30 min and analyzed as in Figure 2A. (F) Leucine deprivation can trigger autophagy in leu1-32 auxotrophic strains. MM cultures of strains CC10 (WT) and CC88 (WT leu1-32), both expressing GFP-Atg8, were shifted or not to leucine (2 h) or nitrogen (3 h) depleted MM and processed and analyzed as in Figure 2 C. Numbers below the panels represent the amount of cleaved GFP relative to the amount after 3 h without nitrogen in WT (with an assigned value of 1). (G) Leucine deprivation can inhibit TORC1 kinase activity in auxotrophic strains. Strains and conditions as in (F) were processed and analyzed as in . (H) The fast negative effect on lifespan of atg mutants auxotrophic for leucine is also displayed by TORC1 mutants with impaired autophagy activation. MM cultures of strains HM123 (WT) and atg1Δ (SK1), CC129 (tsc1Δ), CC134 (tco89Δ) and CC135 (atg1Δ tco89Δ), all carrying the leu1-32 allele, were grown and processed as in (B).
Supplemental Material
Download MS Word (2.5 MB)Data and code availability
All images included in the main and supplemental figures are available as Mendeley dataset (doi: 10.17632/wpvb37w474.1).