Figures & data
Figure 1. Epigenetic reader, BRD4, supports TB pathogenesis in vivo. (A) Schematic for the in vivo mouse TB model and therapeutic treatment regimen. (B) Lung homogenates from mice aerosol infected with Mtb H37Rv for 44 d were assessed for the expression of BRD family genes by qRT-PCR. (C-E) Lungs of mice infected with Mtb H37Rv for 44 d were assessed for the protein level expression of BRD4 by (C) immunoblotting in lung homogenates; (D) immunohistochemistry in infected lung sections and (E) by immunofluorescence imaging on infected lung cryosections. (F and G) The activation of EGFR was assessed (F) in the lung homogenates of 44 d-Mtb H37Rv-infected mice by immunoblotting, and (G) in the infected lung cryosections by immunofluorescence microscopy. (H) Mouse peritoneal macrophages were transfected with NT or Egfr siRNA and infected with Mtb H37Rv for 12 h. Whole cell lysates were assessed for BRD4 expression by immunoblotting. (I and J) H and E staining of lung sections of uninfected/infected/and inhibitor-treated mice (representative image, I; 40X; scale bar: 200 μm; G = granulomatous lesion; AS = alveolar space) and the respective quantification of granuloma score (J, left panel) and granuloma fraction (J, right panel). All qRT-PCR data represents mean±S.E.M. and immunoblotting data is representative of three independent experiments. At least 3 mice were utilized for each analysis derived from lung tissues obtained following therapeutic TB model. Granuloma score and fraction were evaluated in total 8 mice from two independent experiments. Med, medium; *** p < 0.001; ****, p < 0.0001 (Student’s t-test in B; One-way ANOVA in J; GraphPad Prism 8.0); scale bar for IF: 10 μm; Immunohistochemistry (IHC) magnification, 20X (upper panel; scale bar: 300 μm) and 40X (lower panel). ACTB was utilized as loading control.
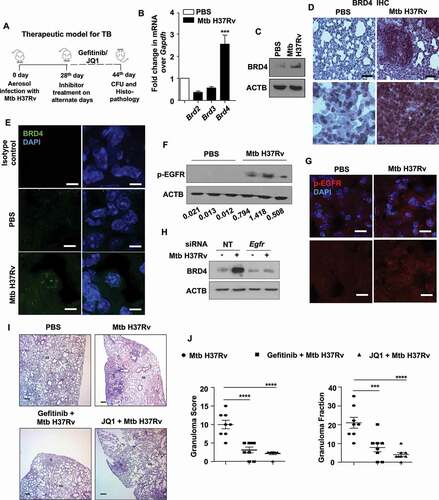
Figure 2. EGFR-BRD4 axis suppresses autophagic flux. (A and B) Mouse peritoneal macrophages were infected Mtb H37Rv. Following 48 h, infected macrophages were treated with (A) gefitinib or (B) JQ1 for 12 h. Cells were then treated with chloroquine for 4 h where indicated, and whole cell lysates were analyzed for autophagy flux by immunoblotting. (C) The status of the indicated autophagy markers was assessed in the lung homogenates from the concerned sets of infected and treated mice (n = 3 mice in each group). (D) Murine peritoneal macrophages were infected with Mtb H37Rv for 4 h, extracellular Mtb H37Rv were washed and cells were incubated with the indicated inhibitors for 48 h and 60 h. Cells were lysed and plated on 7H11 to estimate intracellular Mtb H37Rv burden. (E) Mid log phase Mtb H37Rv cultures were sub-cultured in the presence or absence of JQ1 and plated on 7H11 medium to enumerate corresponding CFU. (F) Mouse peritoneal macrophages were transfected with NT or Atg5 siRNA as indicated. Transfected cells were infected with Mtb H37Rv for 60 h in the presence or absence of JQ1 and assessed for intracellular mycobacterial burden. NT, non-targeting; CFU, colony forming units; *, p < 0.05; **, p < 0.01; *** p < 0.001; ****, p < 0.0001; ns, not significant (Student’s t-test in D, One-way ANOVA in E; GraphPad Prism 5.0, 9.0). ACTB was utilized as loading control.
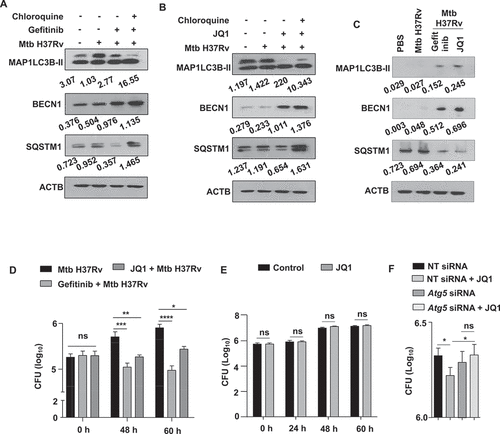
Figure 3. EGFR-dependent BRD4 couples Mtb-induced lipid accumulation and autophagy. (A) Lipid accumulation was observed in the lung cryosections of mice infected with Mtb H37Rv, and treated with gefitinib or JQ1 as indicated, using BODIPY 493/503 staining (n = 3 mice in each group). (B and C) Murine peritoneal macrophages were pre-treated with gefitinib and JQ1 followed by 48 h infection with Mtb H37Rv. Lipid droplets were stained with BODIPY 493/503 and MAP1LC3B was immunostained and observed by confocal microscopy; (B) representative images and (C) the respective quantification. (D and E) Murine peritoneal macrophages were infected with tdTomato Mtb H37Rv for a duration of 60 h, with JQ1 treatment for 4 h, 6 h or 12 h prior to harvest, as indicated. Lipid accumulation and autophagy were assessed using BODIPY 493/503 and MAP1LC3B immunofluorescence, respectively; (D) representative image and (E) quantification. Med, medium; CTCF, corrected total cell fluorescence; *, p < 0.05; *** p < 0.001, ****, p < 0.0001; ns, not significant (one-way ANOVA in C; GraphPad Prism 5.0 & two-way ANOVA in E; GraphPad Prism 8.0); scale bar: 5 μm.
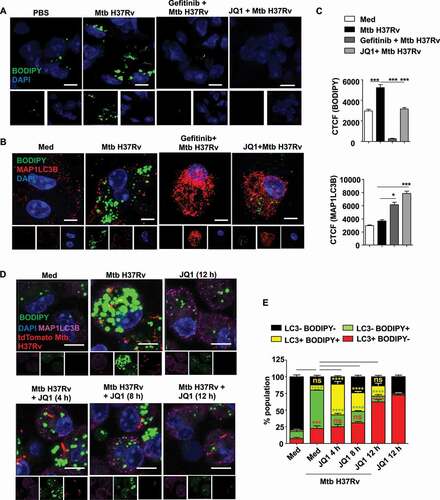
Figure 4. Inhibition of EGFR-BRD4 induces lipophagy. (A) Murine peritoneal macrophages were transfected with NT or Atg5 siRNA. The transfected cells were infected for 48 h with tdTomato Mtb H37Rv followed by 12 h treatment with gefitinib or JQ1 and assessed for lipophagy by staining for LDs with BODIPY 493/503. (B) Mouse peritoneal macrophages were transfected with NT, Egfr or Brd4 siRNAs in the presence or absence of Atg5 siRNA. Transfected cells were infected with Mtb H37Rv for 60 h and assessed for lipid droplet accumulation (BODIPY 493/503) and autophagy (MAP1LC3B) by immunofluorescence. Med, Medium; NT, non-targeting; Scale bar: 5 μm.
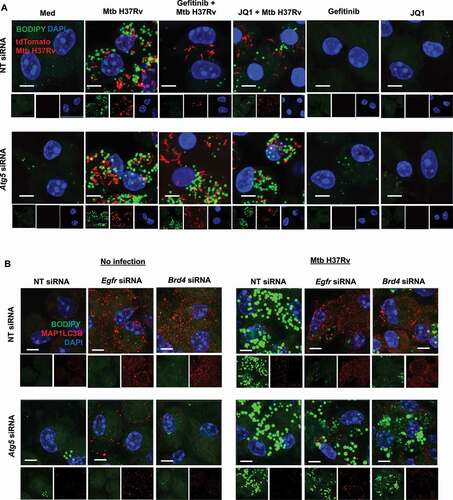
Figure 5. Inhibition of EGFR-BRD4 leads to mycobacterial clearance via LD depletion. (A and B) RAW 264.7 macrophages were transfected with mRFP1-EGFP-PLIN2 construct using Lipofectamine 3000 reagent, along with NT or Atg5 siRNA. The transfected cells were infected for 48 h with Mtb H37Rv followed by 12 h treatment with gefitinib or JQ1 and assessed for lipophagy by analyzing the colocalization of RFP and GFP signals; (A) representative images; (B) respective quantification. (C) Mouse peritoneal macrophages were transfected with NT or Egfr or Brd4 siRNA, in the presence or absence of oleic acid, and subsequently infected with Mtb H37Rv for 60 . Cells were lysed and plated on 7H11 medium to assess mycobacterial burden. Med, Medium; NT, non-targeting; *, p < 0.05; **, p < 0.01; ***, p < 0.001; ****, p < 0.0001 (one-way ANOVA, GraphPad PRISM 9.0).
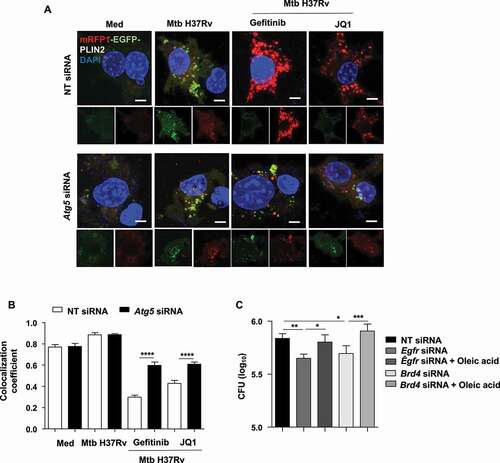
Figure 6. BRD4 modulates angiogenic genes during mycobacterial infection. (A) The transcript levels of the indicated angiogenic genes were assessed in the lung homogenates of mice infected for 44 d with Mtb H37Rv. (B) The protein level of VEGFA was analyzed in Mtb H37Rv-infected lung homogenates by ELISA. (C) The expression of PECAM1 was ascertained by immunofluorescence imaging of infected lung sections. (D) Lung homogenates of infected mice treated with gefitinib or JQ1 was analyzed for the expression of the indicated angiogenic markers by qRT-PCR. (E) The protein level of VEGFA was assessed in the lung homogenates of the indicated groups of mice by ELISA. (F) The expression of PECAM1 was assessed in the lung cryosections of Mtb H37Rv-infected and gefitinib/JQ1-treated mice. At least 3 sets of mice were utilized for each analysis derived from lung tissues obtained following therapeutic TB model and qRT-PCR data represents mean±S.E.M. from five sets of mice. Med, medium; *, p < 0.05; **, p < 0.005; ***, p < 0.001; ****, p < 0.0001 (Students t-test in A, B and one-way ANOVA in D, E; GraphPad Prism 5.0 and 8.0); ns, not significant; scale bar: 10 μm.
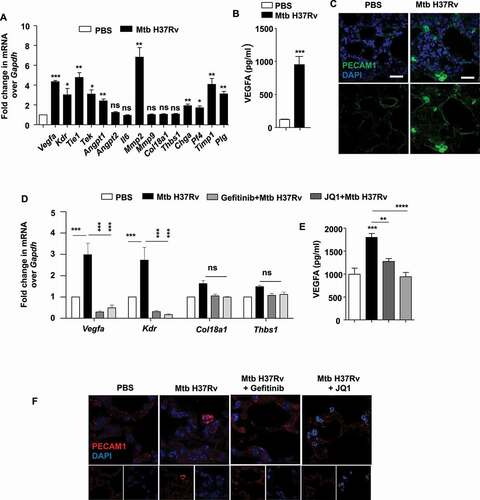
Figure 7. Mtb-dependent KLF5 assists BRD4-mediated regulation of angiogenic markers. (A and B) KLF5 protein expression was assessed (A) in the lung homogenates of 44 d-Mtb H37Rv-infected mice by immunoblotting and (B) in the lung cryosections of infected mice by immunofluorescence imaging (n = 3 mice in each group). (C) Murine peritoneal macrophages were pre-treated with EGFR inhibitor gefitinib for 1 h, followed by 12 h infection with Mtb H37Rv; and whole cell lysates were assessed for the expression of KLF5 by immunoblotting. (D) Mouse peritoneal macrophages were transfected with NT or Egfr siRNA and infected with Mtb H37Rv for 12 h. Whole cell lysates were assessed for KLF5 expression by immunoblotting. (E) Murine peritoneal macrophages were transfected with Klf5 siRNA or NT siRNA for 24 h. Transfected cells were infected with Mtb H37Rv for 12 h and assessed for the expression of the indicated angiogenic genes. (F) Murine peritoneal macrophages were infected with Mtb H37Rv for 12 h and assessed for the interaction of BRD4, EP300 and KLF5 and KLF5 acetylation by immunoprecipitation assay. (G) The recruitment of BRD4 and corresponding H3K27Ac marks were analyzed on the promoters of the indicated genes (at KLF5 binding regions) by ChIP. (H) Sequential ChIP was performed to access the co-occupancy of the indicated promoters by KLF5 and BRD4 in uninfected and Mtb H37Rv-infected peritoneal macrophages. All qRT-PCR data represents mean±S.E.M. and immunoblotting data is representative of three independent experiments. Med, medium; *, p < 0.05; **, p < 0.005; *** p < 0.001 (Students t-test in H and one-way ANOVA in E, G; GraphPad Prism 5.0); ns, not significant; scale bar: 5 μm. ACTB was utilized as loading control.
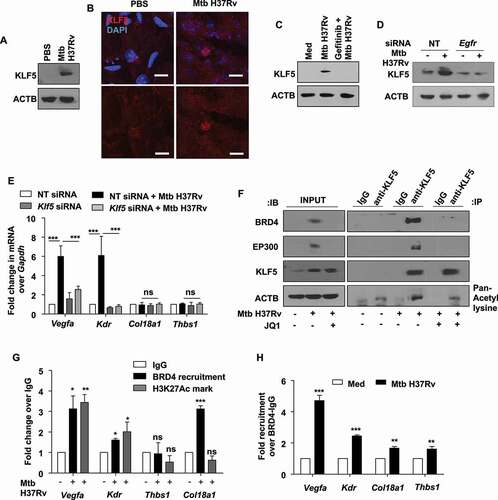
Figure 8. EGFR-PI3K-HIPPO axis regulates angiogenesis markers during mycobacterial infection. (A) Murine peritoneal macrophages were pre-treated with gefitinib and AG1478, followed by 1 h infection with Mtb H37Rv. Whole cell lysates were assessed for the activation of the indicated HIPPO pathway components by immunoblotting. (B) Peritoneal macrophages were pre-treated with LY294002 (PI3K and PtdIns3K inhibitor) or rapamycin (MTOR inhibitor), followed by 1 h infection with Mtb H37Rv and assessed for the activation of Hippo pathway by immunoblotting. (C) Peritoneal macrophages were pre-treated with LY294002 or rapamycin, followed by 12 h infection with Mtb H37Rv and assessed for the expression of KLF5 and BRD4 by immunoblotting. (D) RAW 264.7 macrophages were transfected with the indicated constructs (PIK3R/p85 DN, PIK3C/p110 OE) and transfected cells were infected with Mtb H37Rv for 12 h. Whole cell lysates were assessed for the expression of KLF5 and BRD4 by immunoblotting. (E) Peritoneal macrophages were transfected with Stk4 and Stk3 siRNA, Lats1 siRNAs or NT siRNA for 24 h followed by 12 h infection with Mtb H37Rv; and assessed for (E, left panel) the protein levels of KLF5, BRD4; and (E, right panel) knockdown of Stk4, Stk3 and Lats1, by immunoblotting. (F) The expression of the indicated angiogenic genes was analyzed in the murine peritoneal macrophages pre-treated with gefitinib for 1 h and followed by 12 h infection with Mtb H37Rv. (G) Peritoneal macrophages were pre-treated with LY294002 or rapamycin, followed by 12 h infection with Mtb H37Rv and assessed for the expression of the indicated angiogenesis genes by qRT-PCR. (H) Peritoneal macrophages were transfected with Stk4 and Stk3 siRNA, Lats1 siRNA or NT siRNA for 24 h followed by 12 h infection with Mtb H37Rv; and assessed for the expression of angiogenesis genes by qRT-PCR. All qRT-PCR data represents mean±S.E.M. and immunoblotting data is representative of three independent experiments. NT, non-targeting; Med, medium; DN, dominant-negative; OE, overexpression; *, p < 0.05; **, p < 0.005; *** p < 0.001; ns, not significant (one-way ANOVA in F-H; GraphPad Prism 5.0); ACTB was utilized as loading control.
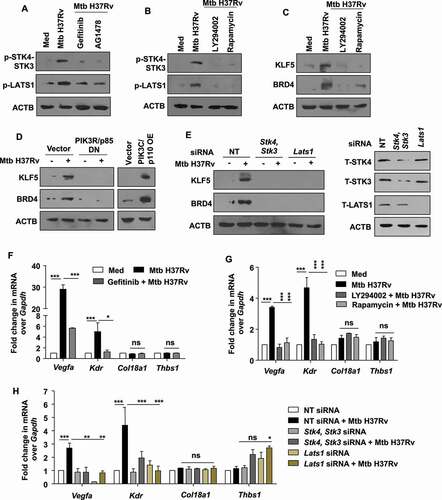
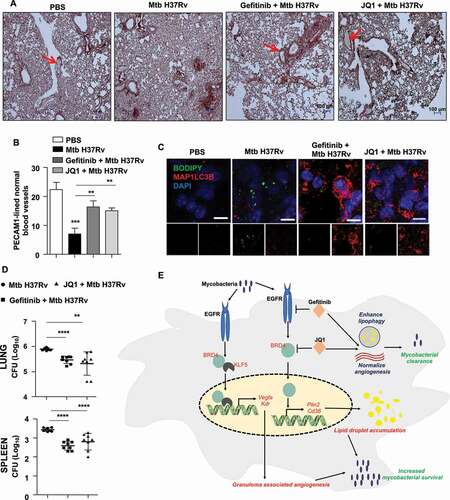
Figure 9. EGFR-BRD4 aids in mycobacterial survival. (A and B) Immunohistochemical analysis of PECAM1 expression in the lung sections of the indicated groups of mice and the respective quantification. PECAM1-lined blood vessels with blood-filled lumen are close representatives of normal vasculature (n = 3 mice in each group). (C) Lung cryosections from the indicated groups of mice were analyzed for autophagy and LD accumulation by MAP1LC3B immunostaining and BODIPY 493/503 staining, respectively (n = 3 mice in each group). (D) The indicated groups of mice were assessed for Mtb H37Rv CFU in the lungs (D, top panel) and spleen (D, bottom panel) (n = 8 mice in each group). (E) Model: Mycobacteria coopts EGFR-BRD4 axis to promote aberrant angiogenesis and suppress lipophagy to thrive within the host milieu. **, p < 0.01; *** p < 0.001; **** p < 0.0001 (one-way ANOVA in B, D; GraphPad Prism 9.0).