Figures & data
Figure 1. Becn1F121A knockin mutation reverses decreased autophagy in neurospheres from older mice. (A) Lysates from DMSO and Baf A1 treated neurosphere from old and young WT mice in normal media probed by immunoblot. n = 3 independent experiments. (B) Mean ± SE of change of autophagy flux (calculated as LC3-II/VCL with Baf A1 divided by LC3-II/VCL without Baf A1) of neurospheres from old WT young mice and old mice. The autophagy flux of WT cells is set as 1 for each experiment. (C) Immunofluorescence for LC3 and DAPI in primary neurospheres from young and old WT mice. (D) Mean ± SE of number of LC3 puncta per cell of primary neurospheres from young and old WT mice were shown. n = 5 independent experiments. (E) Co-immunoprecipitation of BECN1 by BCL2 in neurospheres from WT and KI mice. (F) Mean ± SE of BECN1:BCL2 ratio in the IP samples from 3 independent experiments were shown. (G) Immunofluorescence for LC3 and DAPI in isolated primary neurospheres from old WT and old KI mice. (H) Mean ± SE of number of LC3 puncta per cell of primary neurospheres from old WT and old KI mice. n = 5 independent experiments. (I) Lysates from DMSO – and Baf A1-treated neurospheres of old WT mice and old KI mice probed by immunoblot. (J) Mean ± SE of change of autophagy flux of neurospheres from old WT mice and old KI mice. n = 4 independent experiments. Bar: 10 μm. **: p < 0.01. Student’s t test was used for statistical analysis.
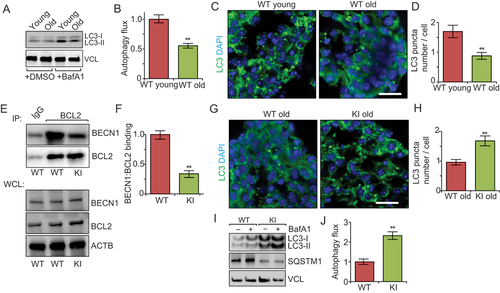
Figure 2. Increased autophagy partially rescues the decline of NSC pool during aging in Becn1 Kl mice. (A) H&E staining of SVZ in 3-months-old and 18-months-old WT and Kl mice. The boxed area is shown in detail on the right side. (B and C) Mean ± SE of SVZ thickness (B) and cell number (C) of WT and Kl mice at 3 mo, 13 mo, and 18 mo. n = 5 animals. (D) Immunofluorescence for GFAP, NES, and DAPI in SVZ of 3-months-old and 18-months-old WT and Kl mice. The boxed area is shown in detail as inset. (E) Mean ± SE of the number of GFAP+ NES+ cells per SVZ section of WT and Kl mice at 3 mo, 13 mo, and 18 mo. n = 5 animals. (F) Immunofluorescence for GFAP, SOX2, and DAPI in SVZ of 3-months-old and 18-months-old WT and Kl mice. The boxed area is shown in detail as inset. (G) Mean ± SE of the number of GFAP+ SOX2+ cells per SVZ section of WT and Kl mice at 3 mo, 13 mo, and 18 mo. n = 5 animals. (H) Immunofluorescence for long-term retentioned BrdU and DAPI in SVZ of 3-months-old and 18-months-old WT and Kl mice. The boxed area is shown in detail as inset. Arrows indicated additional BrdU+ cells in KI mice. (I) Mean ± SE of the number of BrdU+ cells per 1 mm3 SVZ section of WT and Kl mice at 18 mo were shown. n = 5 animals. CC; corpus callosum; E: ependymal; LV: lateral ventricle; RMS: rostral migratory stream; St: striatum; SVZ: subventricular zone. Bar: 100 μm and 50 μm for enlarged panels in A. *: p < 0.05, **: p < 0.01, ***: p < 0.001. ns: no significance. Student’s t test and Two-way Anova were used for statistical analysis.
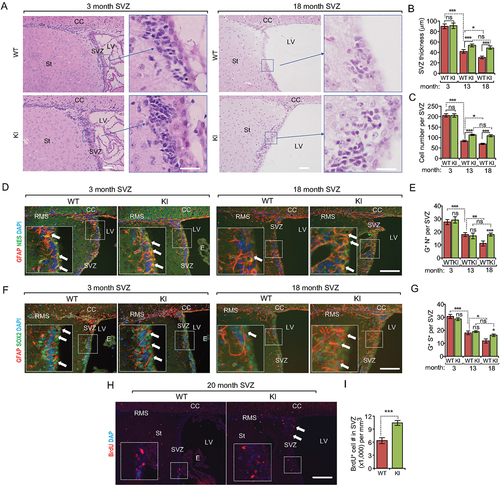
Figure 3. Increased autophagy promotes the growth of neurospheres isolated from old Becn1 Kl mice. (A) Phase contrast images of primary and 20th passaged neurospheres from WT and Kl mice at 3 mo. (B and C) Mean ± SE of the number and size of neurospheres with different passage from WT and Kl mice at 3 mo. Experiments are from 5 animals per group. (D) Phase contrast images of primary and 20th passaged neurospheres from WT and Kl mice at 18 mo. (E and F) Mean ± SE of the number and size of neurospheres with different passage from WT and Kl mice at 18 mo. Experiments are from 5 animals per group. (G, I, K, M) Immunofluorescence for NES (G), SOX2 (I), MKI67 (K), TUNEL (M), and DAPI in sectioned neurospheres at 15th – 20th passages of 3-months-old and 18-months-old WT and Kl mice. (H, J, L, N) Mean ± SE of the percentage of NES+ (H), SOX2+ (J), MKI67+ (L), TUNEL+ (N) cells in neurospheres at 15th – 20th passages of 3-months-old and 18-months-old WT and Kl mice. For each condition, > 2,000 cells from 5 independent experiments were counted. Bar: 100 μm. **: p < 0.01. ns: no significance. Two-way Anova was used for statistical analysis.
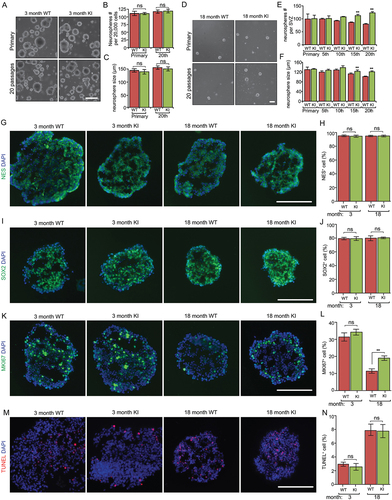
Figure 4. Increased autophagy partially restores the decline of proliferative neurogenesis in the SVZ during aging in Becn1 KI mice. (A) Immunofluorescence for MKI67 and DAPI in SVZ of Becn1 KI and WT mice at 3-months-old and 18-months-old. The boxed area is shown in detail as inset. (B) Mean ± SE of number of MKI67+ cells in SVZ of Becn1 KI and WT mice at 3 mo, 13 mo, and 18 mo. n = 5 animals. (C) Immunofluorescence for DCX and DAPI in SVZ of Becn1 KI and WT mice at 3-months-old and 18-months-old. The boxed area is shown in detail as inset. (D) Mean ± SE of number of DCX+ cells in SVZ of Becn1 KI and WT mice at 3 mo, 13 mo, and 18 mo. n = 5 animals. (E) Immunofluorescence for DCX, MKI67, and DAPI in SVZ of Becn1 KI and WT mice at 3-months-old and 18-months-old. The boxed area is shown in detail as inset. (F) Mean ± SE of percentage of MKI67+ DCX+ cells of total MKI67+ cells in SVZ of Becn1 KI and WT mice at 3 mo, 13 mo, and 18 mo. n = 5 animals. (G) Immunofluorescence for GFAP, NES, MKI67, and DAPI in SVZ of Becn1 KI and WT mice at 3-months-old and 18-months-old. The boxed area is shown in detail as inset. (H) Mean ± SE of percentage of GFAP+ NES+ MKI67+ cells of total MKI67+ cells in SVZ of Becn1 KI and WT mice at 3 mo, 13 mo, and 18 mo. n = 5 animals. (I) Immunofluorescence for S100B and DAPI in SVZ of Becn1 KI and WT mice at 3-months-old and 18-months-old. The boxed area is shown in detail as inset. (J) Mean ± SE of number of S100B+ cells per 1 mm3 SVZ section of KI and WT mice at 3 mo, 13 mo, and 18 mo. n = 5 animals. (K) Mean ± SE of of number GFAP+ NES – astrocyte per 1 mm3 SVZ section of KI and WT mice at 3 mo, 13 mo, and 18 mo. n = 5 animals. (L) Mean ± SE of of number GFAP – NES+ progenitor cells in SVZ of Becn1 KI and WT mice at 3 mo, 13 mo, and 18 mo. n = 5 animals. (M) Immunofluorescence for long term retentioned BrdU, RBFOX3, and DAPI in olfactory bulb of 18-months-old WT and Kl mice. Arrows indicate RBFOX3+ BrdU+ cells. (N) Mean ± SE of number of RBFOX3+ cells per mm2 in the olfactory bulb of Becn1 KI and WT mice at 18 mo. n = 5 animals. (O) Mean ± SE of percentage of RBFOX3+ BrdU+ cells of total BrdU+ cells in the olfactory bulb of Becn1 KI and WT mice at 18 mo. n = 5 animals. CC; corpus callosum; E: ependymal; LV: lateral ventricle; RMS: rostral migratory stream; St: striatum; SVZ: subventricular zone. Bar: 200 μm. *: p < 0.05, **: p < 0.01, ***: p < 0.001. ns: no significance. Student’s t test and Two-way Anova was used for statistical analysis.
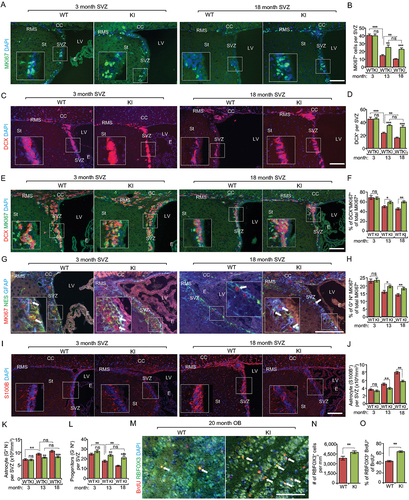
Figure 5. Increased autophagy reduces dysfunctional mitochondria and ROS in NSCs of old Becn1 KI mice. (A and B) Dysfunctional mitochondria in dissociated neurosphere cells from 3-months-old (A) and 18-months-old (B) WT and KI mice were evaluated by the percentage of cells with decreased ratios of MitoTracker Red to MitoTracker Green. (C) Mean ± SE of percentage of dysfunctional mitochondria of total mitochondria in dissociated neurospheres from Becn1 KI and WT mice at 3 mo and 18 mo. (n = 3 mice each). (D) FACS of DCFDA in dissociated neurosphere cells of 3-months-old (left panel) and 18-months-old (right panel) WT mice and KI mice. (E) Mean ± SE of mean fluorescent intensity of DCFDA in dissociated neurospheres from Becn1 KI and WT mice at 3 mo and 18 mo. (n = 3 mice each). **: p < 0.01, ***: p < 0.001. ns: no significance. Student’s t test and One-way Anova were used for statistical analysis.
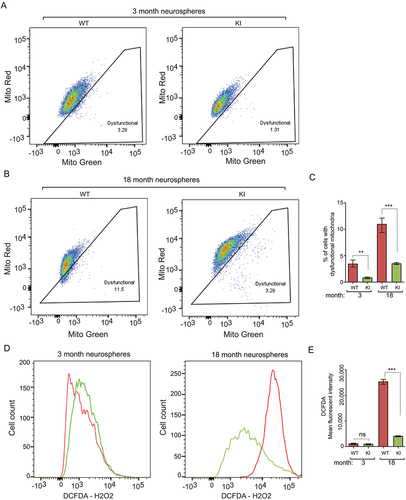
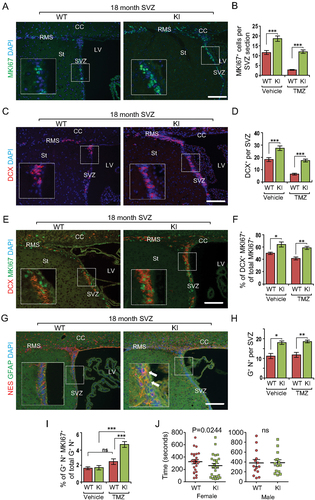
Figure 6. Increased autophagy promotes cell cycle reentry from quiescent NSCs during aging in Becn1 KI mice. (A, C, E, and G) Immunofluorescence for MKI67 (A), DCX (C), DCX and MKI67 (E), GFAP and NES (G), and DAPI in SVZ of 22-months-old Becn1 KI and WT mice 14 d after vehicle or TMZ treatment. The boxed area is shown in detail as inset. (B, D, F, H, and I) Mean ± SE of the number of MKI67+ cells (B), number of DCX+ cells (D), percentage of MKI67+ DCX+ cells of total MKI67+ cells (F), number of GFAP+ NES+ cells (H), and percentage of GFAP+ NES+ MKI67+cells of total GFAP+ NES+ cells (I) in SVZ of 22-months-old Becn1 KI and WT mice 14 d after vehicle or TMZ treatment. n = 4–5 WT mice and KI mice. Arrows indicate GFAP+ NES+ cells in inset. (J) Female Becn1 KI mice (24 mice), but not male Becn1 KI mice (14 mice), at 18–22 months of age performed better than corresponding WT mice in a buried food test (24 female WT mice and 14 male WT mice). CC; corpus callosum; LV: lateral ventricle; RMS: rostral migratory stream; St: striatum; SVZ: subventricular zone. Bar: 100 μm. *: p < 0.05, **: p < 0.01, ***: p < 0.001. Student’s t test and Wilcoxon matched-pairs signed rank test were used for statistical analysis.