Figures & data
Figure 1. A high-content screen for inhibitors of the UPS. (A) Schematic representation of the ubiquitin-fusion degradation (UFD) signal used for the screen. MelJuSo cells stably express ubiquitin fused to YFP (Ub-YFP). A point mutation in glycine 76 to valine (G76V) disrupts the GG motif, hindering cleavage by deubiquitinating enzymes and therefore serving as a degradation signal for the UFD pathway. The rapid turnover of the protein by the proteasome provides cells with low basal YFP levels, which will be elevated upon blockade of ubiquitin-dependent degradation. (B) Workflow of the screen. 17,500 compounds were screened in an automated manner in 384-well plates. An automated analysis was performed to find compounds that elevated YFP over a predefined threshold based on the wells treated with DMSO (negative controls). CBK267272 was selected for further study. More information can be found in Fig. S1 and Table S1. (C) MelJuSo Ub-YFP cells were treated for 6 h with 29 of the structural analogues of CBK267272 at a final concentration of 20 µM. Nuclei were stained with Hoechst 33342 and cells were directly imaged live with an automated widefield microscope. Data are represented as scatter plots, where each dot represents the mean YFP nuclear intensity per cell of one experiment. The mean ± SD of three independent experiments is shown. More information can be found in Table S2. (D) Summary of the findings of the SAR. (E) Chemical structures of the initial hit compound CBK267272 and the selected optimized compound after SAR, CBK288679 (hereafter referred to as CBK79). (F) Representative maximal intensity projections of MelJuSo Ub-YFP cells treated for 6 h with CBK267272 or CBK79 (5 µM). DMSO 0.1% was used as negative control. The nuclei were counterstained with Hoechst 33342 and cells imaged live with an automated widefield microscope. Scale bar: 20 µm. (G) Dose-response curves performed with MelJuSo Ub-YFP cells. Cell viability was assessed after the indicated timepoints. Data are represented as mean ± SD of three independent experiments (except for the 48 h timepoint, which corresponds to two independent experiments). Non-linear curve fitting is depicted in red. The half-maximal inhibitory concentration (IC50) upon CBK79 treatment for each timepoint is shown (95% confidence intervals [CI]).
![Figure 1. A high-content screen for inhibitors of the UPS. (A) Schematic representation of the ubiquitin-fusion degradation (UFD) signal used for the screen. MelJuSo cells stably express ubiquitin fused to YFP (Ub-YFP). A point mutation in glycine 76 to valine (G76V) disrupts the GG motif, hindering cleavage by deubiquitinating enzymes and therefore serving as a degradation signal for the UFD pathway. The rapid turnover of the protein by the proteasome provides cells with low basal YFP levels, which will be elevated upon blockade of ubiquitin-dependent degradation. (B) Workflow of the screen. 17,500 compounds were screened in an automated manner in 384-well plates. An automated analysis was performed to find compounds that elevated YFP over a predefined threshold based on the wells treated with DMSO (negative controls). CBK267272 was selected for further study. More information can be found in Fig. S1 and Table S1. (C) MelJuSo Ub-YFP cells were treated for 6 h with 29 of the structural analogues of CBK267272 at a final concentration of 20 µM. Nuclei were stained with Hoechst 33342 and cells were directly imaged live with an automated widefield microscope. Data are represented as scatter plots, where each dot represents the mean YFP nuclear intensity per cell of one experiment. The mean ± SD of three independent experiments is shown. More information can be found in Table S2. (D) Summary of the findings of the SAR. (E) Chemical structures of the initial hit compound CBK267272 and the selected optimized compound after SAR, CBK288679 (hereafter referred to as CBK79). (F) Representative maximal intensity projections of MelJuSo Ub-YFP cells treated for 6 h with CBK267272 or CBK79 (5 µM). DMSO 0.1% was used as negative control. The nuclei were counterstained with Hoechst 33342 and cells imaged live with an automated widefield microscope. Scale bar: 20 µm. (G) Dose-response curves performed with MelJuSo Ub-YFP cells. Cell viability was assessed after the indicated timepoints. Data are represented as mean ± SD of three independent experiments (except for the 48 h timepoint, which corresponds to two independent experiments). Non-linear curve fitting is depicted in red. The half-maximal inhibitory concentration (IC50) upon CBK79 treatment for each timepoint is shown (95% confidence intervals [CI]).](/cms/asset/e55a0a7c-a2ef-426d-bf80-48fcf6544b1a/kaup_a_1988359_f0001_c.jpg)
Figure 2. CBK79 causes accumulation of ubiquitin-dependent and -independent proteasome substrates. Representative images of MelJuSo Ub-YFP cells treated for 6 h with CBK79 at the indicated concentrations. DMSO at 0.1% was used as negative control. The nuclei were counterstained with Hoechst 33342 and cells imaged live with an automated widefield microscope. Scale bar: 20 µm. (B) Dose-response experiments performed with MelJuSo Ub-YFP cells. Cells were treated for 6 h with a range of compound concentrations. Nuclei were stained with Hoechst 33342 and cells were directly imaged live with an automated widefield microscope. Data were pooled from three independent experiments and are represented as mean ± SD. Non-linear curve fitting is depicted in green. The half-maximal effective concentration (EC50) upon CBK79 treatment is shown (2.2 µM, 95% confidence interval 1.3–4.9). (C) MelJuSo Ub-YFP cells were treated with CBK79 (10 µM) and harvested at the indicated timepoints. Cell lysates were analyzed by immunoblotting with the indicated antibodies. Beta-actin (ACTB) is shown as loading control. Representative blots from one of three independent experiments are shown. (D) MelJuSo Ub-YFP cells were pre-treated for 3 h with the reversible proteasome inhibitor bortezomib (25 nM) to increase the levels of YFP substrate before the treatment. Samples were taken directly after pretreatment (t0). The remaining wells were co-treated with cycloheximide (CHX, 50 µg/ml) and either DMSO 0.1%, epoxomicin (EPX, 100 nM) or CBK79 (10 µM) and harvested after 4 h (CHX 4 h). Cell lysates were analyzed by immunoblotting with the indicated antibodies. Representative blots from one of two independent experiments are shown. (E) Cell lysates from (C) were analyzed by immunoblotting with the indicated antibodies. Representative blots from one of three independent experiments are shown. (F) MelJuSo ZsGreen-ODC cells were treated for 16 h with CBK79 (2.5 µM). The proteasome inhibitor epoxomicin (100 nM) was included as positive control. Nuclei were counterstained with Hoechst 33342 and the cells imaged live with an automated widefield microscope. The nuclear YFP intensity per cell was quantified using MetaXpress. Frequency and distribution of the YFP intensity per cell after background substraction (determined as the nuclear YFP average intensity of all DMSO-treated cells) are shown as violin plots. n = 1308 cells (DMSO); n = 297 cells (CBK79) and n = 207 cells (proteasome inhibitor, epoxomicin 200 nM) from a representative experiment (of two independent experiments). Black lines within each distribution represent the median; colored lines represent the upper and lower interquartile range limits. Significant differences are based on adjusted p-values (Kruskal-Wallis [H = 1075, df = 2, p < 0.0001] with Dunn’s multiple comparisons test). ****p < 0.0001.
![Figure 2. CBK79 causes accumulation of ubiquitin-dependent and -independent proteasome substrates. Representative images of MelJuSo Ub-YFP cells treated for 6 h with CBK79 at the indicated concentrations. DMSO at 0.1% was used as negative control. The nuclei were counterstained with Hoechst 33342 and cells imaged live with an automated widefield microscope. Scale bar: 20 µm. (B) Dose-response experiments performed with MelJuSo Ub-YFP cells. Cells were treated for 6 h with a range of compound concentrations. Nuclei were stained with Hoechst 33342 and cells were directly imaged live with an automated widefield microscope. Data were pooled from three independent experiments and are represented as mean ± SD. Non-linear curve fitting is depicted in green. The half-maximal effective concentration (EC50) upon CBK79 treatment is shown (2.2 µM, 95% confidence interval 1.3–4.9). (C) MelJuSo Ub-YFP cells were treated with CBK79 (10 µM) and harvested at the indicated timepoints. Cell lysates were analyzed by immunoblotting with the indicated antibodies. Beta-actin (ACTB) is shown as loading control. Representative blots from one of three independent experiments are shown. (D) MelJuSo Ub-YFP cells were pre-treated for 3 h with the reversible proteasome inhibitor bortezomib (25 nM) to increase the levels of YFP substrate before the treatment. Samples were taken directly after pretreatment (t0). The remaining wells were co-treated with cycloheximide (CHX, 50 µg/ml) and either DMSO 0.1%, epoxomicin (EPX, 100 nM) or CBK79 (10 µM) and harvested after 4 h (CHX 4 h). Cell lysates were analyzed by immunoblotting with the indicated antibodies. Representative blots from one of two independent experiments are shown. (E) Cell lysates from (C) were analyzed by immunoblotting with the indicated antibodies. Representative blots from one of three independent experiments are shown. (F) MelJuSo ZsGreen-ODC cells were treated for 16 h with CBK79 (2.5 µM). The proteasome inhibitor epoxomicin (100 nM) was included as positive control. Nuclei were counterstained with Hoechst 33342 and the cells imaged live with an automated widefield microscope. The nuclear YFP intensity per cell was quantified using MetaXpress. Frequency and distribution of the YFP intensity per cell after background substraction (determined as the nuclear YFP average intensity of all DMSO-treated cells) are shown as violin plots. n = 1308 cells (DMSO); n = 297 cells (CBK79) and n = 207 cells (proteasome inhibitor, epoxomicin 200 nM) from a representative experiment (of two independent experiments). Black lines within each distribution represent the median; colored lines represent the upper and lower interquartile range limits. Significant differences are based on adjusted p-values (Kruskal-Wallis [H = 1075, df = 2, p < 0.0001] with Dunn’s multiple comparisons test). ****p < 0.0001.](/cms/asset/14aa6c2a-0c9e-44cf-962b-167d9d6dd541/kaup_a_1988359_f0002_c.jpg)
Figure 3. CBK79 inhibits the autophagic flux. (A) Representative images of HOS GFP-LC3B cells. Cells were treated for 4 h with DMSO 0.1%, CBK79 (10 µM) or epoxomicin (EPX, 100 nM). Nuclei were counterstained with Hoechst 33342 and the cells imaged live with an automated widefield microscope. Scale bar: 20 µm. (B) Dose-response experiments performed with HOS GFP-LC3B cells. Cells were treated for 4 h with a range of compound concentrations. Nuclei were stained with Hoechst 33342 and cells were directly imaged live with an automated widefield microscope. Single-cell measurements of GFP-LC3B puncta from a single experiment are shown (n ≥ 193 cells/condition). Data are shown as box plots with median and 5–95 percentiles. (C) HOS GFP-LC3B cells were treated with CBK79 (10 µM) for the indicated timepoints. Nuclei were stained with Hoechst 33342 and cells were directly imaged live with an automated widefield microscope. Single-cell measurements of GFP-LC3B puncta from a single experiment are shown (n > 200 cells/condition). Data are shown as box plots with median and 5–95 percentiles. (D) HOS GFP-LC3B cells were treated with CBK79 (10 µM) and harvested at the indicated timepoints. Cell lysates were analyzed by immunoblotting with the indicated antibodies. Beta-actin (ACTB) is shown as loading control. Representative blots from one out of >3 independent experiments are shown. (E) Analysis of autophagic flux in U2OS mRFP-GFP-LC3B cells treated with DMSO 0.1%, bafilomycin A1 (BafA1, 100 nM) or CBK79 (10 µM) for 4 h, washed briefly in saponin (0.05%) and analyzed by flow cytometry. Autophagic flux was determined as the ratio of mean mRFP- and mean GFP-fluorescence. A representative histogram from one of three independent experiments is shown. (F) Data from (E) were normalized to BafA1. Data are presented as the mean ± SD of three independent experiments (unpaired, two-tailed t-test, t(4) = 12.60, p < 0.0002). (G) Long-lived protein degradation assay in U2OS cells treated with DMSO 0.1%, bafilomycin A1 (BafA1, 100 nM) or CBK79 (10 µM) for 4 h. The percentage of long-lived protein degradation was quantified. Data are presented as the mean ± SD of three independent experiments, each performed in technical duplicates. Significant differences are based on adjusted p-values of multiple comparisons against DMSO (one-way ANOVA [F2,6 = 42.74, p = 0.0003] with Dunnett’s multiple comparisons test). **p = 0.0052; ***p = 0.0002.
![Figure 3. CBK79 inhibits the autophagic flux. (A) Representative images of HOS GFP-LC3B cells. Cells were treated for 4 h with DMSO 0.1%, CBK79 (10 µM) or epoxomicin (EPX, 100 nM). Nuclei were counterstained with Hoechst 33342 and the cells imaged live with an automated widefield microscope. Scale bar: 20 µm. (B) Dose-response experiments performed with HOS GFP-LC3B cells. Cells were treated for 4 h with a range of compound concentrations. Nuclei were stained with Hoechst 33342 and cells were directly imaged live with an automated widefield microscope. Single-cell measurements of GFP-LC3B puncta from a single experiment are shown (n ≥ 193 cells/condition). Data are shown as box plots with median and 5–95 percentiles. (C) HOS GFP-LC3B cells were treated with CBK79 (10 µM) for the indicated timepoints. Nuclei were stained with Hoechst 33342 and cells were directly imaged live with an automated widefield microscope. Single-cell measurements of GFP-LC3B puncta from a single experiment are shown (n > 200 cells/condition). Data are shown as box plots with median and 5–95 percentiles. (D) HOS GFP-LC3B cells were treated with CBK79 (10 µM) and harvested at the indicated timepoints. Cell lysates were analyzed by immunoblotting with the indicated antibodies. Beta-actin (ACTB) is shown as loading control. Representative blots from one out of >3 independent experiments are shown. (E) Analysis of autophagic flux in U2OS mRFP-GFP-LC3B cells treated with DMSO 0.1%, bafilomycin A1 (BafA1, 100 nM) or CBK79 (10 µM) for 4 h, washed briefly in saponin (0.05%) and analyzed by flow cytometry. Autophagic flux was determined as the ratio of mean mRFP- and mean GFP-fluorescence. A representative histogram from one of three independent experiments is shown. (F) Data from (E) were normalized to BafA1. Data are presented as the mean ± SD of three independent experiments (unpaired, two-tailed t-test, t(4) = 12.60, p < 0.0002). (G) Long-lived protein degradation assay in U2OS cells treated with DMSO 0.1%, bafilomycin A1 (BafA1, 100 nM) or CBK79 (10 µM) for 4 h. The percentage of long-lived protein degradation was quantified. Data are presented as the mean ± SD of three independent experiments, each performed in technical duplicates. Significant differences are based on adjusted p-values of multiple comparisons against DMSO (one-way ANOVA [F2,6 = 42.74, p = 0.0003] with Dunnett’s multiple comparisons test). **p = 0.0052; ***p = 0.0002.](/cms/asset/0cab83cd-9401-47b4-9c6c-f1416f212a18/kaup_a_1988359_f0003_c.jpg)
Figure 4. CBK79 induces non-canonical lipidation of LC3B. (A) HOS GFP-LC3B cells were treated with either DMSO 0.1% or CBK79 (10 µM) in co-treatment with the indicated autophagy modulators for 4 h. Cell lysates were analyzed by immunoblotting with the indicated antibodies. Representative blots from one of five independent experiments are shown. MTOR inhibitor (“MTORi”, Torin-1); CQ = chloroquine; 3-MA: 3-methyladenine. (B) Band intensities were measured using ImageJ. LC3B-II band was normalized to the loading control (GAPDH) and the levels are displayed relative to DMSO. Data are shown as average ± SD of five independent experiments. (C) Representative images from HOS GFP-LC3B cells treated with the indicated compounds for 4 h. Nuclei were stained with Hoechst 33342 and cells were directly imaged live with an automated widefield microscope. Scale bar: 20 µm. (D) Quantification of the GFP-LC3B puncta per cell from (C). Data are shown as box plots with median and 5–95 percentiles (n > 200 cells/condition). Significant differences are based on adjusted p-values between relevant conditions (Kruskal-Wallis [H = 1256, df = 9, p < 0.0001] with Dunn’s multiple comparisons test). ns > 0.9999; ****p < 0.0001. (E) HeLa ATG13 knockout (ATG13 KO) cells, or (F) HeLa ATG16L1 knockout (ATG16L1 KO) cells were treated with either DMSO 0.1% or CBK79 (10 µM) in co-treatment with the indicated autophagy modulators for 4 h. Cell lysates were analyzed by immunoblotting with the indicated antibodies. Beta-actin (ACTB) is shown as loading control. Representative blots from one of three independent experiments are shown. (G) HEK293 ATG16L1 knockout cells stably rescued with eGFP-tagged full length ATG16L1β were treated with either DMSO 0.1% or CBK79 (5 µM) in co-treatment with the indicated autophagy modulators for 3 h. Cell lysates were analyzed by immunoblotting with the indicated antibodies. Representative blots from one of three independent experiments are shown. (H) HEK293 ATG16L1 knockout cells stably rescued with eGFP-tagged ATG16L1[1–249] were treated with either DMSO 0.1% or CBK79 (5 µM) in co-treatment with the indicated autophagy modulators for 3 h. Cell lysates were analyzed by immunoblotting with the indicated antibodies. Representative blots from one of three independent experiments are shown.
![Figure 4. CBK79 induces non-canonical lipidation of LC3B. (A) HOS GFP-LC3B cells were treated with either DMSO 0.1% or CBK79 (10 µM) in co-treatment with the indicated autophagy modulators for 4 h. Cell lysates were analyzed by immunoblotting with the indicated antibodies. Representative blots from one of five independent experiments are shown. MTOR inhibitor (“MTORi”, Torin-1); CQ = chloroquine; 3-MA: 3-methyladenine. (B) Band intensities were measured using ImageJ. LC3B-II band was normalized to the loading control (GAPDH) and the levels are displayed relative to DMSO. Data are shown as average ± SD of five independent experiments. (C) Representative images from HOS GFP-LC3B cells treated with the indicated compounds for 4 h. Nuclei were stained with Hoechst 33342 and cells were directly imaged live with an automated widefield microscope. Scale bar: 20 µm. (D) Quantification of the GFP-LC3B puncta per cell from (C). Data are shown as box plots with median and 5–95 percentiles (n > 200 cells/condition). Significant differences are based on adjusted p-values between relevant conditions (Kruskal-Wallis [H = 1256, df = 9, p < 0.0001] with Dunn’s multiple comparisons test). ns > 0.9999; ****p < 0.0001. (E) HeLa ATG13 knockout (ATG13 KO) cells, or (F) HeLa ATG16L1 knockout (ATG16L1 KO) cells were treated with either DMSO 0.1% or CBK79 (10 µM) in co-treatment with the indicated autophagy modulators for 4 h. Cell lysates were analyzed by immunoblotting with the indicated antibodies. Beta-actin (ACTB) is shown as loading control. Representative blots from one of three independent experiments are shown. (G) HEK293 ATG16L1 knockout cells stably rescued with eGFP-tagged full length ATG16L1β were treated with either DMSO 0.1% or CBK79 (5 µM) in co-treatment with the indicated autophagy modulators for 3 h. Cell lysates were analyzed by immunoblotting with the indicated antibodies. Representative blots from one of three independent experiments are shown. (H) HEK293 ATG16L1 knockout cells stably rescued with eGFP-tagged ATG16L1[1–249] were treated with either DMSO 0.1% or CBK79 (5 µM) in co-treatment with the indicated autophagy modulators for 3 h. Cell lysates were analyzed by immunoblotting with the indicated antibodies. Representative blots from one of three independent experiments are shown.](/cms/asset/f76c22f0-d827-47d8-9bcd-6a2c787d29b0/kaup_a_1988359_f0004_c.jpg)
Figure 5. CBK79 induces proteotoxic stress. (A) Representative images of HOS GFP-LC3B cells treated with DMSO 0.1% or CBK79 (10 µM) for 4 h. Cells were fixed and immunostained using antibodies against VIM, SQSTM1, ubiquitin or LAMP1. Scale bar: 20 µm. (B) Line scans at the aggresome sites are shown to visualize the spatial distribution of the indicated proteins (red curves) compared to VIM (gray curves). Intensities are normalized to percentages were 0% = minimum intensity value and 100% = maximum intensity value. (C) MelJuSo Ub-YFP cells were treated with DMSO 0.1% or CBK79 (10 µM) for the indicated timepoints. Two samples were treated for 16 h and then treated with fresh compound solution for the indicated timepoints (“16 h+”). Fifteen minutes before harvesting, puromycin (5 µg/ml) was added to the cells to monitor its incorporation into newly synthesized proteins. Cycloheximide (CHX, 50 µg/ml) was included as control. An untreated sample without puromycin was added (“NP”) as a technical control. Cell lysates were analyzed by immunoblotting with the indicated antibodies. Beta-actin (ACTB) is shown as loading control. Representative blots from one of two independent experiments are shown. (D) MelJuSo Ub-YFP cells were treated with DMSO 0.1% or CBK79 (10 µM) for the indicated timepoints. Two samples were treated for 16 h and then treated with fresh compound solution for the indicated timepoints (“16 h+ re-addition”). Cell lysates were analyzed by immunoblotting with the indicated antibodies. Representative blots from one of three independent experiments are shown. (E) Representative confocal images of MelJuSo Ub-YFP cells treated with DMSO 0.1% or CBK79 (10 µM), alone or in co-treatment with puromycin for 2 h. Cells were fixed and immunostained using antibodies against G3BP1 and puromycin. Scale bar: 20 µm. (F) MelJuSo Ub-YFP cells were pre-treated with DMSO or CBK79 (10 µM) for 30 min and then co-treated with puromycin (5 µg/ml) for 2 h. After nuclei counterstaining with Hoechst 33342, cells were imaged in an automated manner with a widefield fluorescent microscope. The number of G3BP1 foci per cell were quantified using CellProfiler. Pooled data from three independent experiments (DMSO = 1471 cells; DMSO+puromycin = 1521 cells; CBK79+ puromycin = 1467 cells) are shown as box plots with median and 5–95 percentiles. Significant differences are based on adjusted p-values (Kruskal-Wallis [H = 1029, df = 2, p < 0.0001] with Dunn’s multiple comparisons test). ****p < 0.0001. (G) Cells in (F) were analyzed for the number of puromycin foci per cell. Pooled data from three independent experiments (DMSO = 1457 cells; DMSO+puromycin = 1515 cells; CBK79+puromycin = 1472 cells) are shown as box plots with median and 5–95 percentiles. Significant differences are based on adjusted p-values (Kruskal-Wallis [H = 1383, df = 2, p < 0.0001] with Dunn’s multiple comparisons test). ****p < 0.0001.
![Figure 5. CBK79 induces proteotoxic stress. (A) Representative images of HOS GFP-LC3B cells treated with DMSO 0.1% or CBK79 (10 µM) for 4 h. Cells were fixed and immunostained using antibodies against VIM, SQSTM1, ubiquitin or LAMP1. Scale bar: 20 µm. (B) Line scans at the aggresome sites are shown to visualize the spatial distribution of the indicated proteins (red curves) compared to VIM (gray curves). Intensities are normalized to percentages were 0% = minimum intensity value and 100% = maximum intensity value. (C) MelJuSo Ub-YFP cells were treated with DMSO 0.1% or CBK79 (10 µM) for the indicated timepoints. Two samples were treated for 16 h and then treated with fresh compound solution for the indicated timepoints (“16 h+”). Fifteen minutes before harvesting, puromycin (5 µg/ml) was added to the cells to monitor its incorporation into newly synthesized proteins. Cycloheximide (CHX, 50 µg/ml) was included as control. An untreated sample without puromycin was added (“NP”) as a technical control. Cell lysates were analyzed by immunoblotting with the indicated antibodies. Beta-actin (ACTB) is shown as loading control. Representative blots from one of two independent experiments are shown. (D) MelJuSo Ub-YFP cells were treated with DMSO 0.1% or CBK79 (10 µM) for the indicated timepoints. Two samples were treated for 16 h and then treated with fresh compound solution for the indicated timepoints (“16 h+ re-addition”). Cell lysates were analyzed by immunoblotting with the indicated antibodies. Representative blots from one of three independent experiments are shown. (E) Representative confocal images of MelJuSo Ub-YFP cells treated with DMSO 0.1% or CBK79 (10 µM), alone or in co-treatment with puromycin for 2 h. Cells were fixed and immunostained using antibodies against G3BP1 and puromycin. Scale bar: 20 µm. (F) MelJuSo Ub-YFP cells were pre-treated with DMSO or CBK79 (10 µM) for 30 min and then co-treated with puromycin (5 µg/ml) for 2 h. After nuclei counterstaining with Hoechst 33342, cells were imaged in an automated manner with a widefield fluorescent microscope. The number of G3BP1 foci per cell were quantified using CellProfiler. Pooled data from three independent experiments (DMSO = 1471 cells; DMSO+puromycin = 1521 cells; CBK79+ puromycin = 1467 cells) are shown as box plots with median and 5–95 percentiles. Significant differences are based on adjusted p-values (Kruskal-Wallis [H = 1029, df = 2, p < 0.0001] with Dunn’s multiple comparisons test). ****p < 0.0001. (G) Cells in (F) were analyzed for the number of puromycin foci per cell. Pooled data from three independent experiments (DMSO = 1457 cells; DMSO+puromycin = 1515 cells; CBK79+puromycin = 1472 cells) are shown as box plots with median and 5–95 percentiles. Significant differences are based on adjusted p-values (Kruskal-Wallis [H = 1383, df = 2, p < 0.0001] with Dunn’s multiple comparisons test). ****p < 0.0001.](/cms/asset/23ecf573-702e-4dc0-a7dd-59743fcde2dc/kaup_a_1988359_f0005_c.jpg)
Figure 6. CBK79 induces the heat shock response. (A) HOS GFP-LC3B cells were treated with DMSO 0.1% (8 h), CBK79 10 µM (0 to 8 h; a representative image for the 2 h timepoint is shown or epoxomicin (EPX, 100 nM) for 8 h. Cells were fixed and immunostained with an HSF1 antibody. HSF1 nuclear foci are marked with white arrows. Scale bar: 20 µm. (B) The percentage of cells with HSF1 foci from one of two independent experiments are shown. (C) The number of HSF1 foci per cell were quantified using CellProfiler. Data from one of two independent experiments (n > 200 cells/condition) are shown as box plots with median and 5–95 percentiles. (D) MelJuSo Ub-YFP cells were treated with DMSO 0.1% (0) or the indicated concentrations of CBK79 for 6 h. Cell lysates were analyzed by immunoblotting with the indicated antibodies. Beta-actin (ACTB) is shown as loading control. Representative blots from one of three independent experiments are shown. (E) MelJuSo Ub-YFP cells were treated with DMSO 0.1% (0) or the indicated concentrations of CBK79 for 48 h. Cell lysates were analyzed by immunoblotting with the indicated antibodies. Representative blots from one of three independent experiments are shown. (F) Analysis of autophagic flux in U2OS mRFP-GFP-LC3B cells treated with DMSO 0.1%, bafilomycin A1 (BafA1, 100 nM) or CBK79 at the indicated concentrations for 4 h, washed briefly in saponin (0.05%) and analyzed by flow cytometry. Autophagic flux was determined as the ratio of mean mRFP- and mean GFP-fluorescence. A representative histogram from one of three independent experiments is shown. (G) Data from (F) were normalized to BafA1. Data are presented as the mean ± SD of three independent experiments. Significant differences are based on adjusted p-values of multiple comparisons to the DMSO control condition (one-way ANOVA [F4,10 = 4.860, p = 0.0195] with Dunnett’s multiple comparisons test). *p = 0.0388; **p = 0.0064; ns p (0.62) = 0.3356; ns p (1.25) = 0.1791.
![Figure 6. CBK79 induces the heat shock response. (A) HOS GFP-LC3B cells were treated with DMSO 0.1% (8 h), CBK79 10 µM (0 to 8 h; a representative image for the 2 h timepoint is shown or epoxomicin (EPX, 100 nM) for 8 h. Cells were fixed and immunostained with an HSF1 antibody. HSF1 nuclear foci are marked with white arrows. Scale bar: 20 µm. (B) The percentage of cells with HSF1 foci from one of two independent experiments are shown. (C) The number of HSF1 foci per cell were quantified using CellProfiler. Data from one of two independent experiments (n > 200 cells/condition) are shown as box plots with median and 5–95 percentiles. (D) MelJuSo Ub-YFP cells were treated with DMSO 0.1% (0) or the indicated concentrations of CBK79 for 6 h. Cell lysates were analyzed by immunoblotting with the indicated antibodies. Beta-actin (ACTB) is shown as loading control. Representative blots from one of three independent experiments are shown. (E) MelJuSo Ub-YFP cells were treated with DMSO 0.1% (0) or the indicated concentrations of CBK79 for 48 h. Cell lysates were analyzed by immunoblotting with the indicated antibodies. Representative blots from one of three independent experiments are shown. (F) Analysis of autophagic flux in U2OS mRFP-GFP-LC3B cells treated with DMSO 0.1%, bafilomycin A1 (BafA1, 100 nM) or CBK79 at the indicated concentrations for 4 h, washed briefly in saponin (0.05%) and analyzed by flow cytometry. Autophagic flux was determined as the ratio of mean mRFP- and mean GFP-fluorescence. A representative histogram from one of three independent experiments is shown. (G) Data from (F) were normalized to BafA1. Data are presented as the mean ± SD of three independent experiments. Significant differences are based on adjusted p-values of multiple comparisons to the DMSO control condition (one-way ANOVA [F4,10 = 4.860, p = 0.0195] with Dunnett’s multiple comparisons test). *p = 0.0388; **p = 0.0064; ns p (0.62) = 0.3356; ns p (1.25) = 0.1791.](/cms/asset/706932c3-f0e7-4ed5-86ff-a0968d1c4ba8/kaup_a_1988359_f0006_c.jpg)
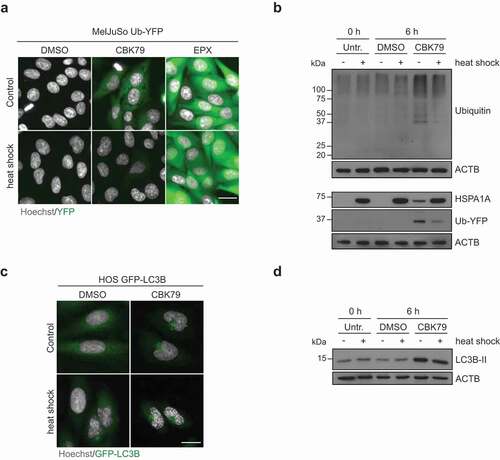
Figure 7. Thermal preconditioning prevents inhibition of the UPS while autophagy impairment persists. (A) Maximum intensity projections of MelJuSo Ub-YFP primed with a 30-min heat shock (43°C), recovered for 8 h, and treated with CBK79 (10 µM), epoxomicin (EPX, 100 nM) or DMSO 0.1% for 6 h. Nuclei were counterstained with Hoechst 33342 and cells imaged in an automated widefield microscope. Scale bar: 20 µm. (B) MelJuSo Ub-YFP were primed with a 30-min heat-shock (43°C), recovered for 8 h, and treated with DMSO 0.1% or CBK79 (10 µM) for 6 h. Cell lysates were analyzed by immunoblotting with the indicated antibodies. Beta-actin (ACTB) is shown as loading control. Representative blots from one of three independent experiments are shown. (C) Maximum intensity projections of HOS GFP-LC3B cells primed with a 30-min heat shock (43°C), recovered for 8 h, and treated with DMSO 0.1% or CBK79 (10 µM) for 4 h. Nuclei were counterstained with Hoechst 33342 and cells imaged in an automated widefield microscope. Scale bar: 20 µm. (D) HOS GFP-LC3B cells were treated as in (C). Cell lysates were analyzed by immunoblotting with the indicated antibodies. Representative blots from one of two independent experiments are shown.