Figures & data
Table 1. Clinical features in patient with Vici-syndrome.
Figure 1. Human platelets isolated from Vici syndrome-patient demonstrate increased LC3 protein levels and accumulate SQSTM1/p62. (A) Freshly isolated platelets from a healthy subject or pediatric patient with Vici syndrome were fixed in suspension immediately after isolation. Representative images are shown. Immunofluorescence staining with an anti-LC3 (yellow) antibody demonstrates expression of increased levels of LC3 in platelets from patient with Vici syndrome when compared to healthy platelets (scale bars: 10 µm). Cells were co-stained using WGA (which binds to glycoproteins of the cell and granule membrane, blue). The yellow box in the merge image demonstrates the origins of the 400x images. (B) Micrographs were analyzed using CellProfiler. The bar graphs display the fold change of mean fluorescent intensity (left, healthy in white and patient with Vici syndrome in gray), fold change of positively stained cells (middle), and fold change of stained particles/positive stained cell (right). (C) Immunoblot analysis of platelet lysates from healthy and Vici patient platelets (± rapamycin to induce autophagy) using an anti-LC3 antibody. Corresponding ACTB/actin as a loading control is depicted (bottom). Molecular masses of the respective proteins are indicated. Left blot with unequal ACTB loading demonstrates that LC3 is present in healthy platelets. The quantitative analysis of LC3-II:ACTB ratio, is shown. (D) Immunoblot analysis of platelet lysates from healthy and Vici-patient platelets (± rapamycin to induce autophagy) using an anti-SQSTM1/p62. Corresponding ACTB as a loading control is depicted (bottom). The quantitative analysis of SQSTM1/p62:ACTB ratio is shown. (E) Immunoblot analysis of platelet lysates from healthy and Vici-patient platelets (± rapamycin to induce autophagy) using an anti-EPG5 antibody. Corresponding ACTB as a loading control is depicted (bottom). The quantitative analysis of EPG5:ACTB ratio is shown. For bar graphs in C, D, and E, non-treated (NT, light gray), and rapamycin (dark gray).
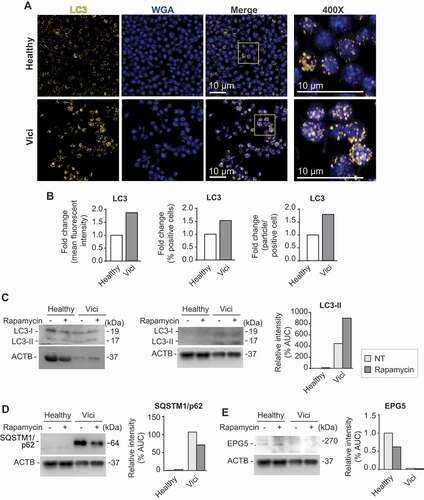
Figure 2. Platelets isolated from septic patient demonstrate increased autophagosomal activity when compared to platelets isolated from healthy individuals. (A) Transmission electron microscopic analysis of healthy platelets (top row) and platelets isolated from septic patients (bottom row, scale bars: 1 µm). Yellow arrows indicate autophagosomes of various content. This figure is representative of n = 5 independent experiments. (B) Bar graph showing the quantitative analysis of autophagosomes being present in healthy versus septic human platelets. The figure represents the analysis of >100 cells per group from n = 5 subjects per group. (C) Images demonstrate healthy platelets (top row) and platelets isolated from septic patients (bottom row) immunostained with an anti-LC3 (yellow), and an anti-LAMP1 (magenta) antibody. Cells were subsequently analyzed using super resolution microscopy. Scale bars: 1 µm. White color expression demonstrates potential colocalization. This figure is representative of n = 4 independent experiments.
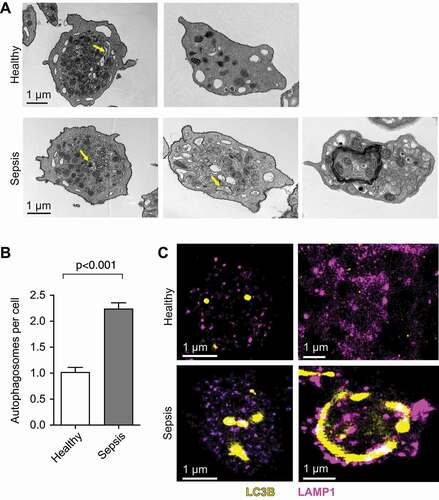
Table 2. Demographic data for the cohort of septic patients.
Table 3. Demographic data for the cohort of healthy controls.
Figure 3. Platelets isolated from septic patients demonstrate late-stage inhibition of autophagy when compared to healthy platelets. (A) Platelets from healthy individuals and septic patients were isolated and treated with rapamycin and/or bafilomycin A1. SQSTM1/p62 accumulation, LC3-I conversion and LC3-II turnover were detected by western blot. Positions of LC3-I and -II are marked. Corresponding ACTB is shown at the bottom and was used for normalization (B). The quantitative analysis of the flux experiments is shown. The graphs are representative of n = 7 independent experiments. AUC, area under curve. (C) SQSTM1/p62 turnover was used as a measure of autophagic flux (AF). Autophagic flux was calculated as referenced in material and methods. The ΔAF was converted from numbers to arrows to directional changes. Stages of autophagy were defined by pattern of ΔAF and corresponding LC3 and SQSTM/p62 levels.
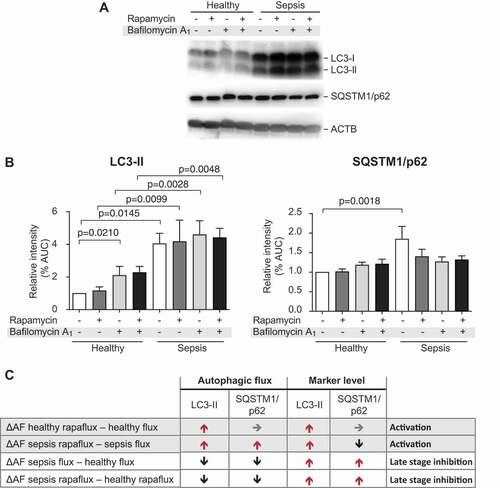
Figure 4. Transcripts coding for key factors of autophagy are differentially expressed in platelets isolated from septic patient when compared to platelets from healthy individuals. Platelets were isolated from healthy individuals or septic patients within 48 h of ICU admission. Total RNA was isolated and next generation RNA-sequencing (RNA-seq) was performed (n = 6–8 per group, respectively). (A) Heat map of upregulated (log2 fold-change > 0, red) and downregulated (log2 fold-change < 0, blue) transcripts in platelets from healthy individuals and septic patients. Black brackets indicate hierarchical grouping. (B) EPG5 expression was verified using qRT-PCR in independent septic patients and healthy controls. The bar graph shows the fold change by ΔΔCT-method (n = 7 subjects per group).
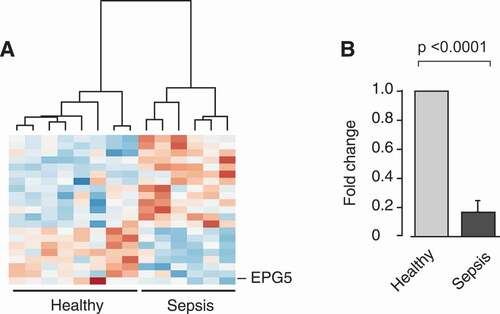
Figure 5. EPG5 protein expression is increased in septic platelets, while EPG5-LC3 interaction decreases during sepsis. (A) Platelets from healthy individuals and septic patients were isolated and treated with rapamycin and/or bafilomycin A1. EPG5 expression levels were detected by western blot. Position of EPG5 is marked. Corresponding ACTB is shown at the bottom and was used for normalization of data presented in bar graph below. This figure is representative of n = 6 independent experiments. (B) Platelets were fixed in suspension immediately after isolation. Immunofluorescence staining with an anti-EPG5 (yellow) antibody demonstrates robust expression of EPG5 protein in platelets from septic patients and healthy platelets (scale bars: 10 µm). Cells were co-stained using WGA (blue). White arrows highlight platelet cell bodies for orientation. This figure is representative of n = 3 independent experiments. (C) Micrographs were analyzed using CellProfiler. The bar graph displays the percent of positively stained cells for EPG5, normalized to IgG. (D) Endogenous LC3 precipitates endogenous EPG5 in a co-IP assay. Input samples as controls are indicated in inserted box. The open circles demonstrate the densitometric analysis of the co-IP experiment for LC3, the overlaid closed squares show the densitometric analysis of co-IP’d EPG5 for each experimental condition. This figure is representative of n = 7 independent experiments. (E) Endogenous LC3 precipitates endogenous EPG5 in a co-IP assay using MKs cultured under simulated septic conditions (LPS treatment) and treated with specific TLR4 inhibitor, CLI-095. This immunoblot is representative of n = 4 independent experiments. In the graph below the immunoblot, the open circles demonstrate the densitometric analysis of the co-IP experiment for LC3, while the overlaid closed squares show the densitometric analysis of co-IP’d EPG5.
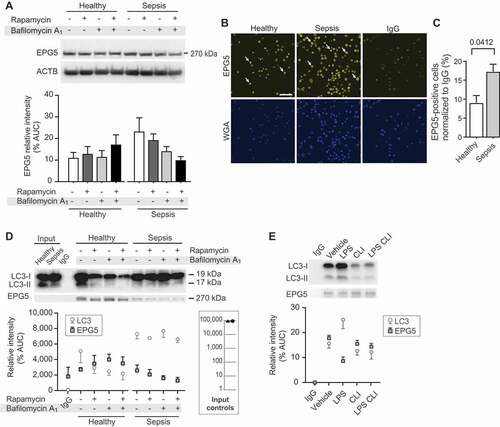
Figure 6. RAB7 RNA and protein expression levels are dynamic during sepsis. (A) Changes in RAB7 RNA expression levels are shown (n = 6 subjects per group). (B) RAB7 RNA expression was measured using qRT-PCR. The bar graph shows the fold change by ΔΔCT-method (n = 3 subjects/group, ns). (C) Western blots (used in Figure 5A) were stripped and re-probed to detect RAB7 protein expression levels. Position of RAB7 is marked. Corresponding ACTB loading control is shown at the bottom (same as shown in Figure 5A) and was used for normalization of data presented in bar graph below. This figure is representative of n = 6 independent experiments. Significance is indicated by exact p-value where statistically significant.
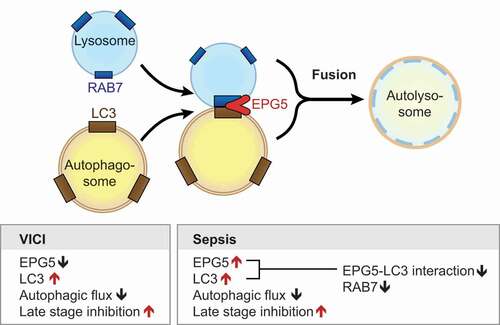
Figure 7. Sepsis induces TLR-4 dependent dysregulation of EPG5-LC3 protein-protein interaction resulting in decreased autophagic flux and late-stage inhibition. Model showing how EPG5 mediates fusion of autophagosomes with lysosomes. EPG5 is recruited to lysosomes by associating with RAB7 and LC3. Left box summarizes know autophagic determinates from the literature and our findings for Vici-patient. The right box synopsizes our experimental findings in septic patients, making comparisons between patients with Vici syndrome and sepsis where possible.