Figures & data
Table 1. Demographic data of the WDR45 cohort.
Table 2. Definition of clinical endpoints, associated research questions and research strategies employed in this study.
Figure 1. Estimated survival for WDR45-related NDD using the Kaplan-Meier method. 140/160 individuals (nmale = 20, nfemale = 120) were assessed for survival estimations. 20/160 individuals were excluded due to missing data for age at last follow-up (n = 7), sex (n = 3) or both (n = 10). Data were censored at the time of last follow-up if the individual was not reported as deceased. 95% confidence intervals are illustrated as shaded background. No significant differences were detected. Statistic testing was done using the log-rank test comparing sex.
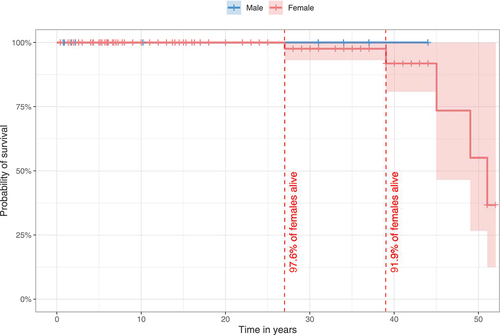
Figure 2. Age at onset and diagnostic delay of WDR45-related NDD. Data were assessed in 78/160 cases (nmale = 12, nfemale = 66). 82/160 individuals were excluded from analysis due to missing age (n = 69), sex (n = 1) or both (N = 12). Connecting lines represent data derived from the same individuals. Statistical testing was done using the Mann-Whitney U test.
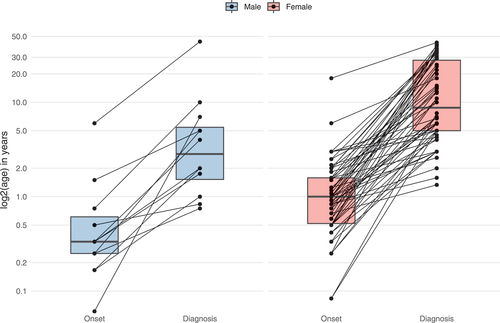
Figure 3. Subgroup analysis of the phenotypic spectrum of WDR45-related NDD. A total of 19 males (ninfancy/childhood = 12, nadolescence/adulthood = 7) and 118 females (ninfancy/childhood = 55, nadolescence/adulthood = 63) were examined. (A) Number of phenotypic features per individual with respect to 63 non-redundant Human Phenotype Ontology terms. Statistic testing was done using the Mann-Whitney U test. P values were adjusted for multiple hypothesis testing using the Benjamini-Hochberg procedure. ns = not significant. (B) Frequencies of Human Phenotype Ontology ancestor terms derived phenotypic features. Frequencies greater than 20% were printed on the respective bars. Statistical testing was done using Pearson’s Chi-squared test or Fisher’s exact test (in case of less than 5 counts per subgroups). P values were adjusted for multiple hypothesis testing using the Benjamini-Hochberg procedure.
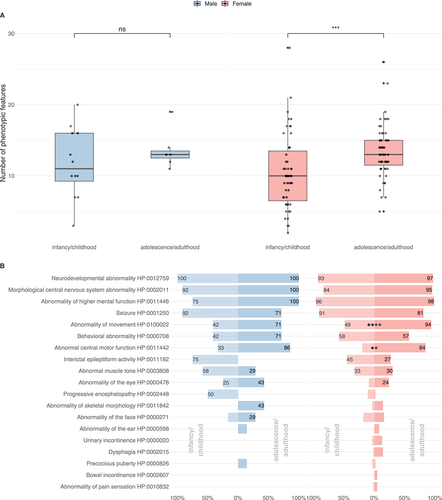
Table 3. Early and late WDR45-related manifestations stratified by sex.
Figure 4. Ages at first report of early and late WDR45-related manifestations stratified by sex. (A) Age at first report of developmental delay (nmale = 8, nfemale = 35), epileptic seizures (nmale = 13, nfemale = 71) and epileptic spasms (nmale = 6, nfemale = 11) shown as time-dependent proportions. Age is depicted in years. The median age at onset is highlighted with dashed lines. (B) Age at first report of brain iron deposition (nmale = 8, nfemale = 59), movement disorders (nmale = 9, nfemale = 67), developmental regression (nmale = 3, nfemale = 24) and mental deterioration (nmale = 3, nfemale = 33) shown as time-dependent proportion. Age is depicted in years. The median age at onset is highlighted with dashed lines. No significant differences were detected between the two groups. Statistical testing was done using the Mann-Whitney U test.
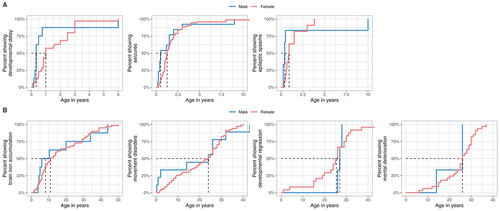
Figure 5. Distribution of reported disease-causing variants in WDR45. (A) Chromosomal region of WDR45 including 11 exons illustrated as green rectangles. Chromosomal positions of disease-causing variants are indicated by vertical lines. Variants resulting in frameshifts and premature stop codons are plotted above and the remaining variants below the gene. (B) Densities of pathogenic WDR45 variants from the literature (red) and benign variants from the gnomAD genomes database (green) according to their chromosomal position. Densities show mainly reciprocal distributions suggesting little tolerance in the healthy population toward variation in regions of pathogenic variant enrichment. (C) Heat map visualization of variant effect prediction score values for all possible missense variants according to their position of amino acid exchange within the WDR45 protein sequence. Arithmetic means of REVEL score values at any protein position are color-coded. WD repeat domains are highlighted by dashed lines. Reported WDR45 missense variants are shown as black ticks. Accumulation of high score values in the C-terminal section of WDR45 suggest a functional relevance of this region with low tolerance to missense variation.
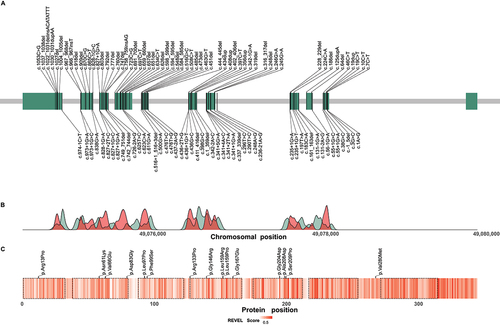
Table 4. Demographic data of the WDR45 cohort stratified by predicted mutational effect.
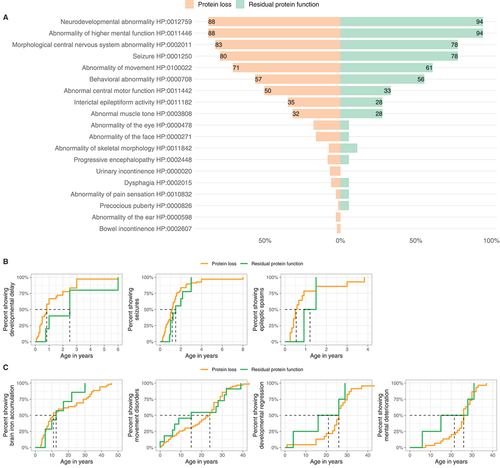
Figure 6. Genotype-phenotype association analysis of WDR45-related NDD. (A) Frequencies of reported Human Phenotype Ontology ancestor terms derived phenotypic features stratified for predicted variant effects (nProtein loss = 129/160, nResidual protein function = 18/116). Frequencies greater than 20% are printed on the respective bars. No significant differences were detected. Statistical testing was done using Pearson’s Chi-squared test or Fisher’s exact test (in case of less than 5 counts per subgroup). (B and C) Age at first report of early and late manifestations stratified by predicted mutational effects. (B). First report of ndevelopmental delay (nProtein loss = 30, nResidual protein function = 4), epileptic seizures (nProtein loss = 68, nResidual protein function = 9) and epileptic spasms (nProtein loss = 14, nResidual protein function = 2). (C). First report of brain iron deposition (nProtein loss = 52, nResidual protein function = 7), movement disorders (nProtein loss = 63, nResidual protein function = 11), developmental regression (nProtein loss = 23, nResidual protein function = 4) and mental deterioration (nProtein loss = 30, nResidual protein function = 4). Age is depicted in years. The median age at presence of specific symptoms is marked by dashed lines. No significant differences were detected. Statistic testing was done using the Mann-Whitney U test.