Figures & data
Figure 1. VMP1 staining in human pancreatitis samples. (A) Representative images of H&E staining of human normal and pancreatitis samples. Bar: 100 µm. (B) Individual histology score of H&E staining was graded. Data are mean ± SE (n = 13–52). **p < 0.01; Student t-test analysis. (C) Representative images of Sirius red staining and IHC staining for MPO and KRT19 in human normal donor (ND) and CP tissues. Bar: 100 µm. (D) Representative images of VMP1 IHC staining in human mild and severe CP tissues. Bar: 100 µm. (E) Correlation of VMP1 staining score with fibrosis, inflammation, and ADM scores.
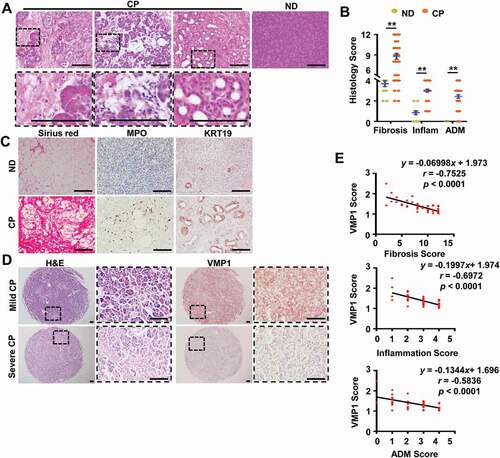
Figure 2. Decreased VMP1 expression in experimental AP mouse models. (A) Immunoblotting analysis using total lysates from pancreatic tissues. (B) Pancreatic mRNA was extracted followed by qPCR analysis. Results were normalized to Rn18s and expressed as fold change compared to control group. Data shown are mean ± SE (n = 3–5). *p < 0,05; **p < 0,01; Student t-test analysis. (C) Representative images of H&E staining from either cerulein or ethanol-induced AP mouse pancreatic tissues are shown. Bar: 100 µm.
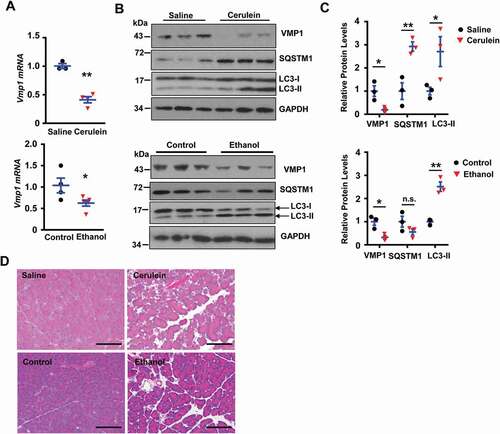
Figure 3. Loss of acinar cell VMP1 induces spontaneous pancreatitis reminiscent of chronic pancreatitis. Two-months old male and female Tg(Cela1-cre/ERT)/BAC-Ela-Cre−; Vmp1f/f (Vmp1 WT) and Tg(Cela1-cre/ERT)/BAC-Ela-cre+; vmp1f/f (vmp1 KO) mice were injected with tamoxifen (75 mg/kg) once a day for consecutive 3 days, and these mice were sacrificed 5 days after the last injection of tamoxifen. (A) Representative images of H&E staining are shown. Bar: 100 µm. (B) Individual histology score of H&E staining was graded. M: male; F: female. Data are mean ± SE (n = 5–11). **p < 0.01; Student t-test analysis. Representative images of (C) TUNEL, (D) Sirius red, (E) ADGRE1/F4/80, and (F) MPO staining are shown. Bar: 100 µm. Pancreatic mRNA was extracted followed by qPCR analysis for fibrotic genes (G) and inflammation genes (H). Results were normalized to Rpl13a and expressed as fold change compared to Vmp1 WT group. Data shown are mean ± SE (n = 6–11). **p < 0,01; Student t-test analysis. Representative images of (I) KRT19, (J) SOX9, (K) YAP1, and (L) PCNA IHC staining are shown. Scale bars: 100 µm. (M) Immunoblotting analysis using total lysates from pancreatic tissues followed by densitometry analysis. Data are normalized to WT and are mean ± SE (n = 3–4).
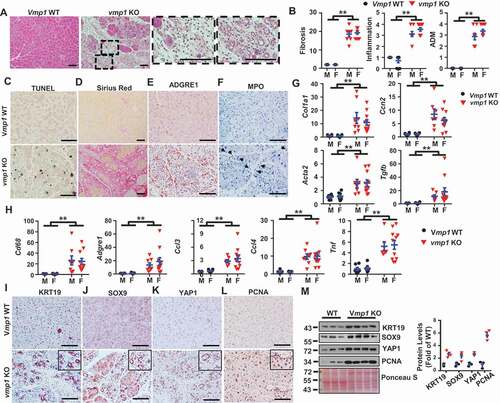
Figure 4. Loss of acinar cell VMP1 impairs autophagic degradation and induces ER stress. Immunoblotting analysis using total lysates from pancreatic tissues for autophagy markers (A). Representative images of IHC staining of (B) VMP1, (C) SQSTM1, and (D) ubiquitin (UB) from 2-months-old WT and vmp1 KO mouse pancreatic tissues. Bars: 100 µm. Immunoblotting analysis for ER stress (E) markers. (F) Pancreatic mRNA was extracted followed by qPCR analysis. Results were normalized to Rpl13a and expressed as fold change compared to Vmp1 WT group. M: male; F: female. Data shown are mean ± SE (n = 4–10). **p < 0,01; Student t-test analysis. (G) Representative EM images of pancreatic tissues from WT and Vmp1 KO mice are shown. Bars: 500 nm. Arrowheads: dilated ER.
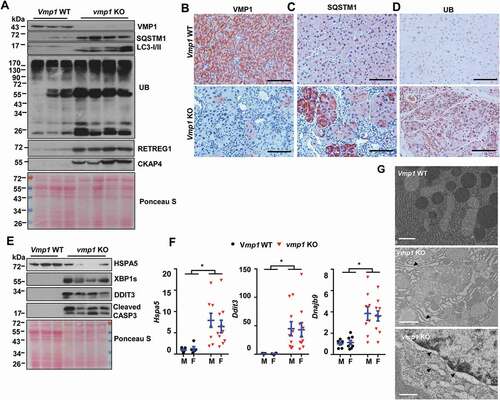
Figure 5. Increased NFE2L2 activation in pancreatic acinar-cell specific vmp1 KO mice and increased SQSTM1 and ER stress in human CP. Two-months old Tg(Cela1-cre/ERT)/BAC-Ela-Cre−; Vmp1f/f (Vmp1 WT) and Tg(Cela1-cre/ERT)/BAC-Ela-cre+; vmp1f/f (vmp1 KO) mice were injected with tamoxifen (75 mg/kg) once a day for consecutive 3 days, and these mice were sacrificed 5 days after the last injection of tamoxifen. (A) mRNA was extracted from pancreatic tissues followed by qPCR analysis. Results were normalized to Rpl13a and expressed as fold change compared to VMP1 WT group. Data shown are mean ± SE (n = 3–4). *p < 0,05; **p < 0,01; Student t-test analysis. (B) Immunoblotting analysis using total lysates from pancreatic tissues. (C) Representative images of immunohistochemistry staining of NQO1 from 2-months old WT and Vmp1 KO mouse pancreatic tissues. (D) Representative images of IHC staining for SQSTM1 and NQO1. Bar: 100 µm. (E) Representative EM images of human ND and CP tissues are shown. Bar: 2 µm.
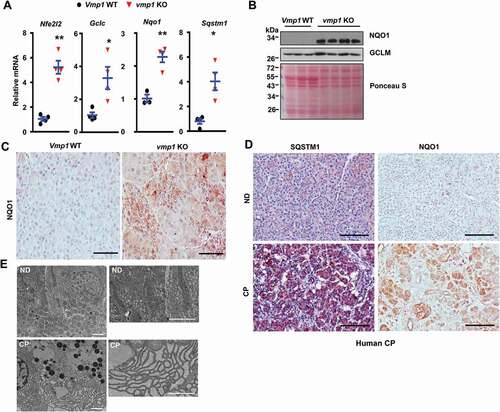
Figure 6. Deletion of nfe2l2 attenuates vmp1 deficiency-induced pancreatitis. Two-months-old Tg(Cela1-cre/ERT)/BAC-Ela-Cre−; Vmp1f/f (Vmp1 WT), Tg(Cela1-cre/ERT)/BAC-Ela-cre+; vmp1f/f (vmp1 KO), Tg(Cela1-cre/ERT)/BAC-Ela-cre−; Vmp1f/f nfe2l2 KO (nfe2l2 KO), Tg(Cela1-cre/ERT)/BAC-Ela-cre+; vmp1f/f nfe2l2 KO (vmp1, nfe2l2 DKO) mice were injected with tamoxifen (75 mg/kg) once a day for consecutive 3 days, and these mice were sacrificed 5 days after the last injection of tamoxifen. (A) Representative images of H&E staining of Vmp1 WT, nfe2l2 KO, vmp1 KO, and vmp1, nfe2l2 DKO mice are shown. Bar: 100 µm. (B) Histology score was quantified. Data shown are mean ± SE (n = 8–13). **p < 0,01; One-way ANOVA analysis. (C) Representative images of Sirius red, ADGRE1/F4/80, MPO, KRT19, SOX9, and YAP1 staining are shown. Bar: 100 µm. (D) Pancreatic mRNA was extracted followed by qPCR analysis. Results were normalized to Rpl13a and expressed as fold change compared to Vmp1 WT group. Data shown are mean ± SE (n = 10–17). **p < 0,01; One-way ANOVA analysis. (E) Immunoblotting analysis using total pancreatic lysates from indicated genotypes of mice.
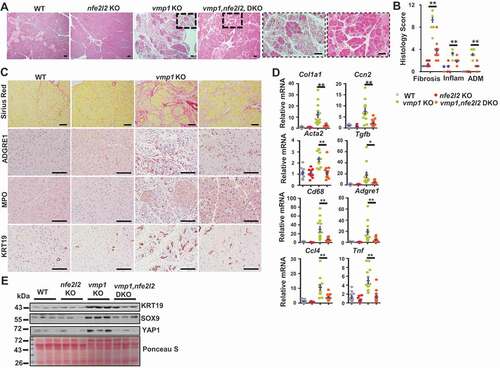
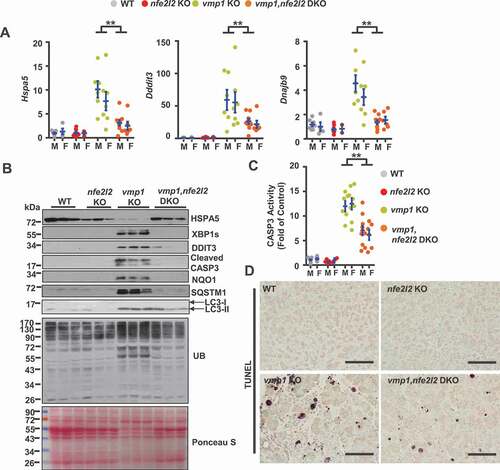
Figure 7. Deletion of nfe2l2 ameliorates vmp1 deficiency-induced ER stress and cell death. Two-months-old Tg(Cela1-cre/ERT)/BAC-Ela-Cre−; Vmp1f/f (Vmp1 WT), Tg(Cela1-cre/ERT)/BAC-Ela-cre+; vmp1f/f (vmp1 KO), Tg(Cela1-cre/ERT)/BAC-Ela-cre−; Vmp1f/f nfe2l2 KO (nfe2l2 KO), Tg(Cela1-cre/ERT)/BAC-Ela-cre+; vmp1f/f nfe2l2 KO (vmp1 nfe2l2 DKO) mice were injected with tamoxifen (75 mg/kg) once a day for consecutive 3 days, and these mice were sacrificed 5 days after the last injection of tamoxifen. (A) Immunoblotting analysis using total pancreatic lysates from indicated genotypes of mice. (B) CASP3 activities were determined using total pancreatic lysates from indicated genotypes of mice. Data shown are mean ± SE (n = 5–13). **p < 0.01; One-way ANOVA analysis. (C) Representative images of TUNEL staining are shown. Scale bar: 100 µm.