Figures & data
Figure 1. SHISA5-depletion enhanced autophagy. (A) Left panel: western blot analysis of LC3 levels in HeLa, A549, U2OS, and HEK293 cells treated with control or SHISA5 siRNAs. Right panel: quantifications of LC3-II levels normalized to housekeeping protein level. The level of LC3-II in control siRNA transfected cells is set to 1.00. (B) TEM images of WT cells and SHISA5 KO HeLa cells. The boxed areas showing SHISA5 KO cells are magnified (boxes i, ii, and iii). White arrowheads point to autolysosomes or lysosomes. Black arrowheads indicate autophagosomal membrane. Black arrow indicates amphisomes. Quantifications of the electron-dense structures in the cells are shown in the right panel. The error bars indicate SD (n = 15 for WT and 19 for SHISA5 KO cells). See Figure S1B for the source images used for representative images. (C) Autophagosomal structures juxtaposed with ER. Black arrowheads indicate where ER and the autophagosomal membranes closely reside. See Figure S1C for the source images used for representative images. Scale bar: 1 μm. (D) WT and SHISA5 KO HeLa cells were transfected with empty vector or SHISA5-DsRed plasmid (cyan) for 48 h. Representative immunofluorescence images showing LC3B (green) and LAMP1 (red) staining. (E) Quantification of the LC3+ particles (left panel), LAMP1− LC3+ particles (middle panel), and LAMP1+ LC3+ particles (right panel) in the images performed using ImageJ. The error bars indicate SEMs (n = 16–23). Scale bar: 10 μm.
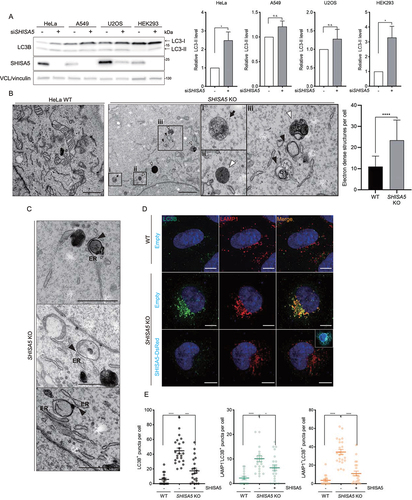
Figure 2. SHISA5-depletion enhanced autophagy only under basal conditions. (A) Representative immunofluorescence images of LC3B (green) and LAMP1 (red) in WT and SHISA5 KO HeLa cells. Cells were transfected with empty vector or SHISA5-DsRed plasmid (cyan). Then cells were incubated in complete medium (NT) or EBSS 2 h. (B) The numbers of LC3 puncta in each cell were quantified. (C) The colocalization of LC3B and LAMP1 was calculated by determining the Pearson’s correlation coefficient using ImageJ (n = 10–16). (D) Representative immunofluorescence images of LC3B (green) in WT and SHISA5 KO HeLa cells. Cells were transfected with empty vector or SHISA5-DsRed plasmid (cyan). Then cells were treated with DMSO (NT) or 100 nM of Torin 1 for 2 h. (E) The numbers of LC3B puncta per cells were quantified. (F) WT and SHISA5 KO HeLa cells were untreated with DMSO or Baf A1 (100 nM) for 4 h before cell lysis. Western blot analysis for LC3B and TUBA1B/α-tubulin is shown in the upper panel. Quantification of LC3-II levels normalized to TUBA1B level is shown in the lower panel. (G) Left panel: confocal images of WT HeLa cells and SHISA5 KO cells stably expressing mRFP-GFP-LC3B. Cells were incubated in complete medium (NT) or EBSS for 2 h. See Figure S2B for the images before merge. Right panel: the number of red and yellow puncta per cell was determined using ImageJ plugins and plotted. The error bars indicate SEMs. Scale bar: 10 μm.
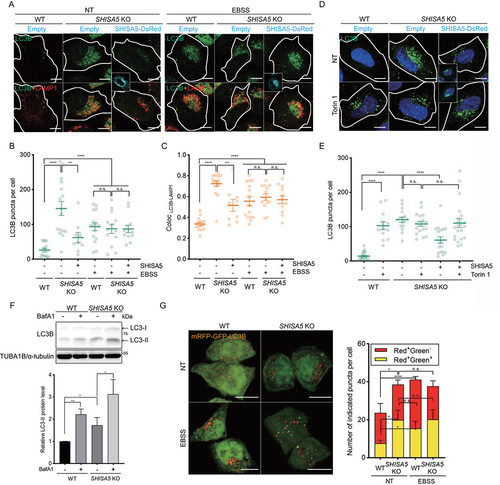
Figure 3. The loss of SHISA5 enhanced basal autophagy in a PtdIns3K-C1-dependent manner. (A) Schematic diagram depicting the genetic hierarchy of the early stage in autophagosome biogenesis at ER membrane. (B) Immunoblot analysis of phospho-ULK1 S757 (MTORC1 phosphorylation site), ULK1, phospho-RPS6KB1 T389 (MTORC1 phosphorylation site), RPS6KB1, LC3B, and TUBA1B in WT and SHISA5 KO HeLa cell lysates. Quantifications of band intensity from three independent experiments are noted. (C) Upper-left panel: representative immunofluorescence images of LC3B (green) in WT and SHISA5 KO HeLa cells. Cells were transfected with control or RB1CC1 siRNA and then incubated in complete medium (NT) or EBSS for 2 h. Lower-left panel: RB1CC1 knockdown efficiency was confirmed by western blot. Right panel: the number of LC3B puncta per cell was quantified (n = 15–22). (D) Right panel: representative immunofluorescence images of LC3B (green) in WT and SHISA5 KO HeLa cells. Cells were treated with DMSO or 50 μM of SBI-0206965 for 2 h in either complete medium (NT) or EBSS. Left panel: the LC3B puncta per cell were quantified (n = 13–27). (E) Upper-left panel: representative immunofluorescence images of WT and SHISA5 KO HeLa cells stained for LC3B (green) following transfection with control or PIK3C3 siRNA. Upper-right panel: the LC3B puncta per cell were quantified (n = 31–35). Lower panel: PIK3C3 knockdown efficiency was confirmed by western blot. (F) Left panel: representative immunofluorescence images of WT and SHISA5 KO HeLa cells stained for LC3B (green) following DMSO or SAR405 (1 μM) treatment for 2 h. Right panel: the LC3B puncta per cell were quantified (n = 15–21). All scale bars: 10 μm.
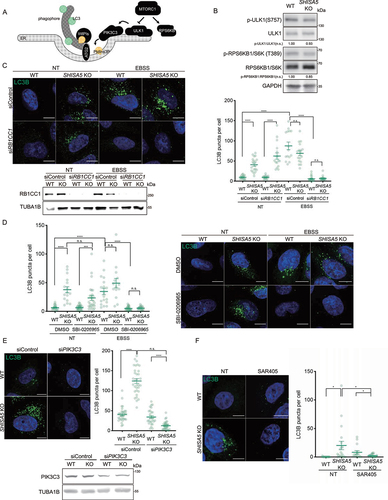
Figure 4. SHISA5 blocked ER-phagophore contact. (A) Representative images of proximity ligation assay (PLA) between SEC16A and WIPI2 in WT and SHISA5 KO HeLa cells. Cells were treated with DMSO (NT) or Torin 1 (100 nM, 5 min). As negative controls, the use of only one primary antibody (either anti-SEC16A or anti-WIPI2 antibody alone) resulted in no signal. To well visualize the PLA signal, the color lookup tables are inverted without changing the pixel value. See Figure S4B for the representative images of PLA before inverting the image display. Right panel: the number of PLA signal in each cells was quantified by the BlobFinder (n = 48–62). (B) Left panel: representative images of proximity ligation assay (PLA) between SEC16A and WIPI2 in WT and SHISA5 KO HeLa cells. Cells were transfected for 48 h with either empty vector or SHISA5-DsRed plasmid (red). Right panel: the number of PLA signal in each cells was quantified using ImageJ plugins. Data are shown as bars with dots and represent the mean± SEM (n = 15–21). See Figure S4C for the representative images of PLA before inversion. (C) Immunoblot analysis of WT and SHISA5 KO HeLa cell lysates for SEC16A, SEC31A, WIPI2, LC3B, GAPDH, and TUBA1B. Quantification of band intensity from three independent experiments is noted. (D) Left panels: representative images of proximity ligation assay (PLA) between SEC31A and LC3B in WT and SHISA5 KO HeLa cells. Cells were transfected with control siRNA or siATG2A plus siATG2B. As negative controls, the use of only one primary antibody (either with anti-SEC31A or anti-LC3B antibody alone) resulted in no signal. Right panel: the number of PLA signal in each cells was quantified by BlobFinder. Data are shown as bars with dots and represent the mean± SEM (n = 125–156). See Figure S4D for the representative images of PLA before inverting the image display. All scale bars: 10 μm. (E) CLEM of SHISA5 KO cells co-transfected with EYFP-SEC31A (green) and mcherry-LC3B (red). Upper panels show low-magnification images with a boxed region of interest (ROI). Scale bar: 5 μm. Lower panels show enlarged ROI with arrowheads indicating close association of SEC31A and LC3B. Black arrowhead marks the contact between SEC31A and LC3B-positive structures that are electron dense. White arrowhead marks the contact between SEC31A and LC3B-positive autophagic membrane. The ER membranes (green) and LC3B-positive membranes (red) are roughly traced and show in the lower rightmost panel. Scale bar: 500 nm.
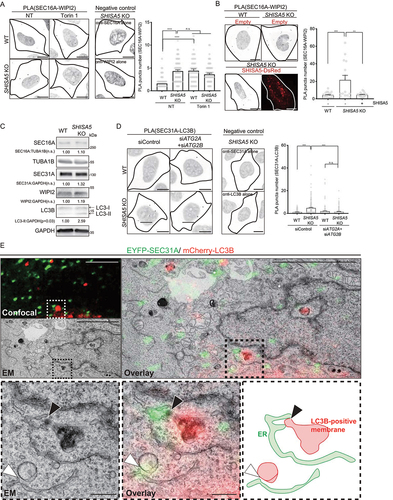
Figure 5. The cytosolic PRD of SHISA5 was required for the inhibitory role of SHISA5 at the contact. (A) Left panel: schematic diagram of the orientation of SHISA5 within the ER membrane. Right panel: domain structures of SHISA5 mutants used for analysis. (B, C) WT and SHISA5 KO HeLa cells were transfected with control empty, SHISA5-DsRed, TMPRD-SHISA5-DsRed, or TMCRD-SHISA5-DsRed plasmid (red) for 48 h. (B) LC3B puncta were immunostained and shown in the right panel. The numbers of LC3B puncta in each cell was quantified and shown in the left panel (n = 11–17). (C) Right: representative images of PLA between SEC16A and WIPI2 are shown, along with negative controls incubated with antibody against either SEC16A or WIPI2 alone. Left: the PLA signals in the indicated samples were quantified using ImageJ plugins (n = 10–15). See Figure S5A for the representative images of PLA before inverting the image display. (B) and (C) are derived from three and two independent experiments, respectively. The error bars indicate SEMs. All scale bars: 10 μm.
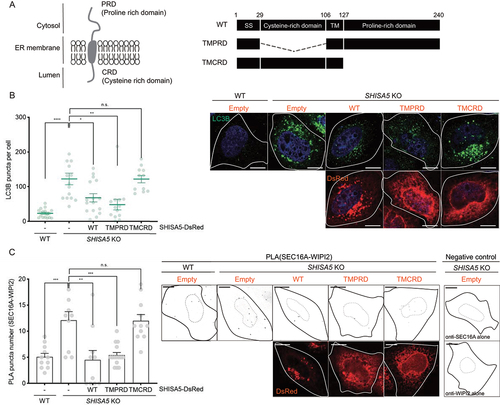
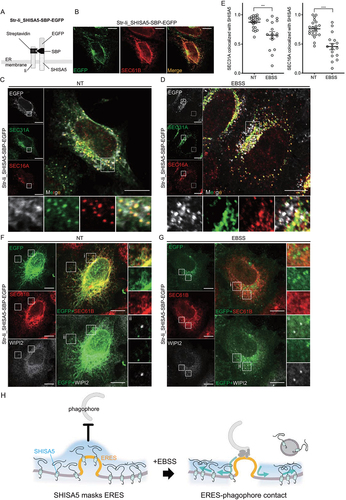
Figure 6. Localization of SHISA5 altered in relation to ERES upon autophagy-inducing conditions. (A) A schematic illustration for how Str-Ii_SHISA5-SBP-EGFP protein is retained in ER membrane. (B) Representative immunofluorescence image of SHISA5 KO cells expressing Str-Ii_SHISA5-SBP-EGFP (green), immunostained with SEC61B (red). (C–E) Representative immunofluorescence images of SHISA5 KO cells expressing Str-Ii_SHISA5-SBP-EGFP (gray). Green and red marks ERES staining with anti-SEC31A and anti-SEC16A antibody, respectively. Cells were incubated in complete medium (C) or EBSS (D) for 1 h. Manders’ correlation coefficients were quantified using the ImageJ plugin Colocalization threshold and plotted in (E) (n = 16–21). The error bars indicate SEMs. (F, G) Representative immunofluorescence images of WIPI2 (gray) and SEC61B (red) in SHISA5 KO cells. Cells were transfected with Str-Ii_SHISA5-SBP-EGFP (green). Cells were incubated in complete medium (F) or EBSS (G) for 1 h. (H) Schematic illustration for the role of endogenous SHISA5 function in relation to ERES-phagophore contact under basal or autophagy-inducing conditions.