
Figures & data
Figure 1. SS patients have a positive correlation between LAMP3 expression and LC3B puncta. (A, B) LC3B staining in the same representative cases. LC3B highlights the acinar, ducts, and lymphocytic infiltrates in SS more so than Non-SS including abundant perinuclear LC3 aggregates in acini of the SS case. Scale bar: 30 μm. Using ICY image analysis, LC3B puncta (0.5–2.0 μm) were counted using a spot detection algorithm and compared relative to the total number of nuclei per acini. Three representative images with at least 3–5 acini per image at 1000X resolution with a 60 z-stack series of images taken at 0.2 μm resolution (x,y,z) were counted and compared between non-SS and SS. Isotype controls for each case demonstrated negligible nonspecific staining (data not shown). The outlier non-SS (bracketed) cases with numbers of LC3B puncta similar to SS had clinical profiles suggestive of SS but did not strictly meet 2002 AECG classification criteria including: 2/3 had autoantibodies to Ro/SSA and also either subjective or objective dry mouth and/or dry eyes, but not both; or incomplete clinical data for a single subject. These results indicate possible evolving SS or other autoimmune disease and also the clinical heterogeneity of SS. Because of our strict adherence to a priori classifications of subjects in this data set, the cases were retained with this caveat. (C) Analysis of correlation of LAMP3 expression and the number of LC3B puncta was performed with Pearson correlation. (Corr: 0.221, p = 0.0182; Pearson’s correlation). (D, E) LAMP3 and LC3B staining in the same representative cases. Scale bar: 25 μm. LAMP3 and LC3B levels in each puncta were analyzed and then plotted. The size of each dot in the graph means their relative size. * p < 0.05, Student’s t-test.
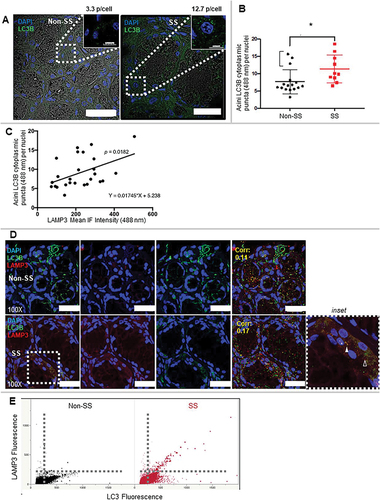
Figure 2. LAMP3 decreased protein degradation via inhibited autophagy. (A) Representative blotting of HSG control and LAMP3-OE cells treated with or without 25 μM CQ for 6 h. The ratio of LC3-II to TUBA and SQSTM1 to TUBA was calculated, and relative change to control was plotted. Values shown are mean ± SD. SQSTM1: N = 4; LC3-II: N = 7. The effect of LAMP3 on phosphorylation of MTOR in (B) HSG and (C) A253 cells was analyzed using western blot and representative blotting was shown. The ratio of phosphorylated MTOR (p-MTOR) to total MTOR was calculated, and relative change to control was plotted. The values shown are mean ± SD. N = 5 (HSG cells); N = 4 (A253 cells). (D) Representative blots show total and phosphorylated protein of ULK1 and EIF4EBP1. The ratio of phosphorylated protein to total protein in each protein was calculated, and relative change to control was plotted. Values shown are mean ± SD. N = 3. Representative blotting of (E) HSG and (F) A253 LAMP3 stable OE cells (HSG-LAMP3 cells and A253-LAMP3 cells). “∴” indicates nonspecific band. The ratio of EGFP-RFP-LC3 protein degradation in (G) HSG-control and HSG-LAMP3 cells, and (H) A253-control and A253-LAMP3 cells was examined using western blot and representative blotting was shown. The ratio of free EGFP to EGFP-RFP-LC3 was calculated, and relative change to control was plotted. Values shown are mean ± SD. N = 10 (HSG cells); N = 4 (A253 cells). (I) The long-lived protein degradation assay was performed as described in materials and methods (Dashed line: without labeling; Bold line: with labeling). The relative change of fluorescence intensity to HSG-control cells was plotted. Values shown are mean ± SD. N = 5. ¶ p < 0.05, Ratio paired t-test. † p < 0.05, †† p < 0.01, ††† p < 0.001, Tukey’s multiple comparisons test.
Figure 3. LAMP3 induced dysfunction in the lysosome. (A) The acidic environment in HSG control and LAMP3-OE cells was analyzed using EGFP-RFP-LC3 protein with or without CQ treatment. The number and mean area of red colored LC3 puncta in each cell were analyzed and plotted. GFP-positive cells in the cells co-transfected with 0.75 μg of GFP plasmid and a total 0.75 μg of pME18S-empty and pME18S-LAMP3 plasmid of (B) HSG cells and (C) A253 cells were analyzed using Flow cytometry with LysoTracker DND-99 (Black line: without LysoTracker; Red line: with LysoTracker). The mean fluorescence intensities compared with control were shown. Values shown are mean ± SD. N = 3. (D) Immunocytochemistry analysis of HSG control (lower panels) and LAMP3-OE cells (upper panels) was performed. Scale bar: 50 μm. LGALS3-puncta positive cells (in 100 of control or LAMP3-OE cells) were counted, and the percentage was plotted. Values shown are mean ± SD. N = 4. (E) Lysosomal protein degradation capacity in A253 control and LAMP3-OE cells were measured using DQ-BSA (Dashed line: without DQ-BSA; Normal line: with DQ-BSA). Relative changes to control were plotted. Values shown are mean ± SD. N = 4. *** p < 0.001, unpaired Student’s t-test. † p < 0.05, †† p < 0.01, ††† p < 0.001, Tukey’s multiple comparisons test.
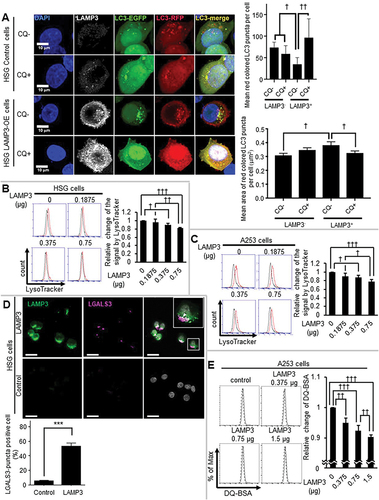
Figure 4. LAMP3 induced CTSB dependent degradation of LAMP1. (A) The expression of LAMP1 and ATP6V1A in HSG control and LAMP3-OE cells was examined using western blot and representative blotting was shown. The results were normalized by TUBA, and relative change to control was plotted. Values shown are mean ± SD. LAMP1: N = 3; ATP6V1A: N = 5. (B) LAMP1 mRNA expression levels in HSG control and LAMP3-OE cells were measured using qRT-PCR. N = 3. (C) HSG control and LAMP3-OE cells were incubated with 50 μg/ml CHX and harvested at 0, 2, 4 and 8 h. Cells lysates were analyzed by western blot. The amount of LAMP1 remaining after CHX treatment for 2, 4 and 8 h was calculated as the fold change of the protein present at 0 h. Values shown are mean ± SD. N = 3. (D) HSG control and LAMP3-OE cells were incubated with 50 μg/ml CHX following pretreatment with 10 μM pepA, E64D or MG132 for 1 h, and harvested at 8 h. Cells lysates were analyzed by western blot. The amount of LAMP1 remaining after CHX treatment for 8 h was calculated as the relative change of the protein to HSG LAMP3-OE control cells. Values shown are mean ± SD. N = 7. * p < 0.05, unpaired Student’s t-test. † p < 0.05, †† p < 0.01, ††† p < 0.001, Tukey’s multiple comparisons test.
Figure 5. LAMP3 induced relocalization of lysosomal enzymes to the cytoplasm. (A) Representative western blots of cytoplasmic LAMP1, CTSB and CTSD in HSG control and LAMP3-OE cells. Membrane-bound organelle fraction contained lysosomes and other organelles. Protein levels were normalized to TUBA, and relative protein levels to control were plotted. Values shown are mean ± SD. LAMP1: N = 5; CTSB: N = 4; CTSD: N = 3. Immature type of cathepsins, and mature type of cathepsins were indicated as “IM” and “M”, respectively. (B, C) CTSD activity in cytoplasm was measured as described in Materials and Methods. The obtained fluorescence intensity was normalized to sample protein concentration, and relative change to control was plotted. Values shown are mean ± SD. N = 3. (D) Confocal immunofluorescence analysis of HSG control and LAMP3 cells treated with or without CQ was performed. The correlation of LAMP1 and activated CTSD vesicles in each cell was investigated. Dotted or dashed squares signifies area of inset in row of images following subsequently for LAMP3+ and LAMP3− cells. Dotted and dashed ellipses are areas of LAMP3+ and LAMP3− cells demonstrating differential colocation of activated CTSD and LAMP1. (E) Confocal immunofluorescence analysis of HSG control and LAMP3 cells was performed. The correlation of V-ATPase (ATP6V1A) and activated CTSD vesicles in each cell was investigated. Dotted or dashed squares signifies area of inset in row of images for LAMP3+ and LAMP3− cells. Scale bar: 20 μm and 5 μm (inset). Dotted and dashed circles are areas of LAMP3+ and LAMP3− cells demonstrating differential colocation of activated CTSD and V-ATPase. ¶ p < 0.05, Ratio paired t-test. * p < 0.05, *** p < 0.001 unpaired Student’s t-test. †† p < 0.01, ††† p < 0.001, Tukey’s multiple comparisons test.
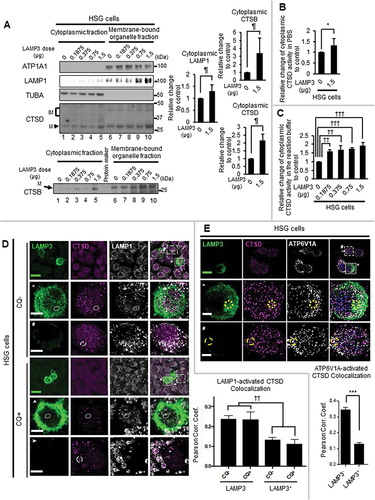
Figure 6. LAMP3 induced apoptosis was inhibited by LAMP1 OE or the inhibitor of CTSB or CTSD. (A) Representative western blots of A253-LAMP3 cells transfected with GFP plasmid and LAMP1 plasmid or control plasmid. (B) Forty-eight hours post-transfection, apoptotic cells in GFP-positive cells were determined by Flow cytometry using APC-ANXA5/annexin V-7-AAD. The difference of the rate of ANXA5+ cells in GFP-positive cells of A253-LAMP3 transfected with LAMP1 cells from that in GFP-positive cells in A253-control cells was plotted. N = 4. (C) Immunocytochemistry analysis of A253-control (upper panels) and A253-LAMP3 cells (lower panels) transfected with empty-GFP plasmid (left side) or LAMP1-GFP plasmid (right side) was performed. Scale bar: 50 μm. LGALS3-puncta positive cells in 100 cells of each group were counted, and the percentage was plotted. Values shown are mean ± SD. N = 3. (D) HSG control and LAMP3-OE cells were incubated with or without 20 μM Z-VAD or 5 μM pepA for 14 h. Apoptotic cells in GFP-positive cells were determined by Flow cytometry using APC-ANXA5/7-AAD. The difference of the rate of ANXA5+ cells in GFP-positive cells of LAMP3-OE cells treated with or without 20 μM Z-VAD or 5 μM pepA from that in GFP-positive cells in control cells was plotted. Values shown are mean ± SD. N = 3. (E) HSG control and LAMP3-OE cells were incubated with or without 20 μM Z-VAD or 2.5 μM E64D for 14 h. Apoptotic cells in GFP-positive cells were determined by Flow cytometry using APC-ANXA5/7-AAD. The difference of the rate of ANXA5+ cells in GFP-positive cells of LAMP3-OE cells treated with or without 20 μM Z-VAD or 2.5 μM E64D from that in GFP-positive cells in control cells was plotted. N = 3. *** p < 0.001, unpaired Student’s t-test. † p < 0.05, ††† p < 0.001, Tukey’s multiple comparisons test. # p < 0.05, ### p < 0.001, Dunnett’s multiple comparisons test.
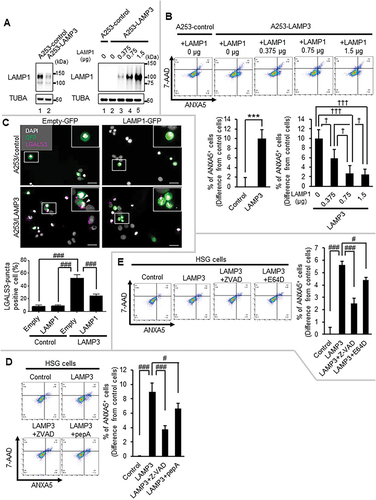
Figure 7. LAMP3 induced apoptosis is associated with the activity of CASP1 and CASP3. (A) BID mRNA expression levels in HSG control and LAMP3-OE cells were determined by using qRT-PCR. N = 3. (B) Representative western blots of HSG control and LAMP3-OE cells were performed to measure BID and CASP3 expression. BID and CASP3 expression levels were normalized to TUBA. The relative change compared with control was plotted. Values shown are mean ± SD. CASP3: N = 5; BID: N = 3. (C) Cleaved CASP3 activity in HSG control and LAMP3-OE cells was measured as described in Materials and Methods. The relative change compared with control was plotted. Values shown are mean ± SD. N = 3. (D) Fourteen hours post-treatment with 5 μM pepA, cleaved CASP3 activity was compared. The relative change to control was plotted. Values shown are mean ± SD. N = 4. (E) HSG control and LAMP3-OE cells were incubated with or without 20 μM Z-VAD or 10 μM Z-DEVD for 14 h. Apoptotic cells in GFP-positive cells were determined by Flow cytometry using APC- ANXA5/7-AAD. The difference of the rate of ANXA5+ cells in GFP-positive cells of LAMP3-OE cells treated with or without 20 μM Z-VAD or 10 μM Z-DEVD from that in GFP-positive cells in control cells was plotted. Values shown are mean ± SD. N = 4. (F) HSG control and LAMP3-OE cells were incubated with or without 20 μM Z-VAD or 50 μM Y-VAD for 14 h. Apoptotic cells in GFP-positive cells were determined by Flow cytometry using APC- ANXA5/7-AAD. The difference of the rate of ANXA5+ cells in GFP-positive cells of LAMP3-OE cells treated with or without 20 μM Z-VAD or 50 μM Y-VAD from that in GFP-positive cells in control cells was plotted. N = 4. ¶ p < 0.05, Ratio paired t-test. † p < 0.05, †† p < 0.01, ††† p < 0.001, Tukey’s multiple comparisons test. # p < 0.05, ### p < 0.001, Dunnett’s multiple comparisons test.
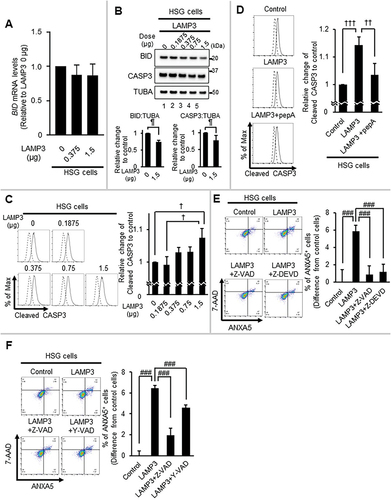
Figure 8. LAMP3 inhibited autophagy and induced apoptosis via lysosomal membrane permeabilization. LAMP3 OE in minor salivary gland of SS patient leads to lysosomal membrane permeabilization via decreasing LAMP1 protein integrity and its degradation by CTSB, resulting in inhibited autophagy, and cathepsins relocalization. Relocalized cathepsins (CTSB and CTSD) induces the increase in cell death by caspase-dependent apoptosis.
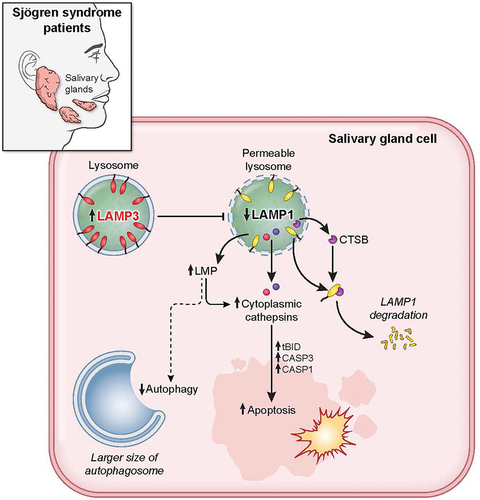
Table 1. Summary of antibodies used for western blotting.