Figures & data
Figure 1. The rapidly expanding autophagy research field. (A) The number of autophagy publications (blue) and last authors (red) from 1965–2020 are shown with a linear scale (left) and a logarithmic scale (right). With a logarithmic scale, the publication history of autophagy can be loosely classified into 3 phases according to the gradient of the graph. (B) A stacked bar plot of publications in the autophagy research field from 1965–2020 showing the percentage of last authors (taken to represent laboratories) publishing in the field for the first time. (C) Stacked bar plots of percentages of autophagy publications from 1965–2020 with the indicated citation counts (obtained from Web of Science in January 2021). (D) Stacked bar plots of percentages of autophagy publications that were published in journals with the indicated 5-Year journal impact factors (left) or article influence scores (right; see Figure S1 for normalized eigenfactor score; all scores obtained from incites journal citation report 2019). The data can be found in Data S2.
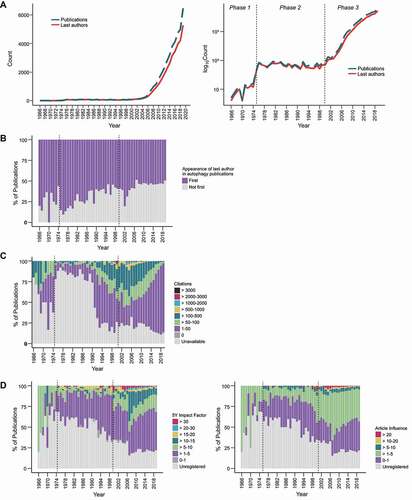
Figure 2. The prevalence of official gene names in autophagy publications. (A) The number of genetic elements detected, categorized by their assigned locus group as found in the HUGO gene nomenclature committee database. 4008 protein-coding genes, 206 non-coding RNAs, 9 pseudogenes and 4 “other” (referring to a fragile site, protocadherin, complex locus constituent, and unknown) were found. (B) For each genetic element, the number of publications it was mentioned in (indicating how frequently it was mentioned) was plotted against the average publication year (sum of publication years divided by number of publications; indicates how recent it was mentioned). Left: linear y-axis; right: log2 y-axis. (C) Top occurring protein-coding genes (left) and non-coding RNAs (right) in the titles and abstracts of autophagy publications.
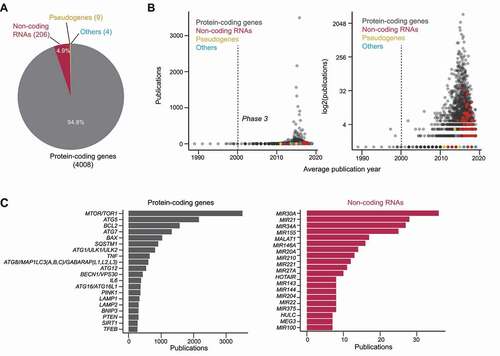
Figure 3. The prevalence of autophagy-associated genes in autophagy publications. (A) Top occurring autophagy genes in the titles and abstracts of autophagy publications (presented in the nomenclature for protein products). (B) The top few most mentioned autophagy genes of selected years of phase 2 and phase 3. Genes within the same table cells have the same frequency. Ellipses indicate the presence of more results (provided in Data S4). (C) The publication trends of the categories of autophagy genes (categorized according to their main function) in total frequency for each category per year (left) and percentage of total number of studies (right).
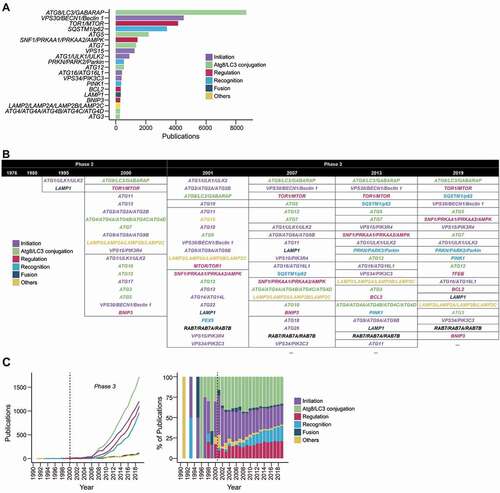
Figure 4. Non-autophagy genes in autophagy publications. (A) The top 20 most mentioned non-autophagy genes (of Homo sapiens and Saccharomyces cerevisiae) found in the titles and abstracts of autophagy publications. (B) The top few non-autophagy genes of selected years of phase 2 and phase 3. Genes that are in the same border occurred the same frequency. Genes ending with “’s” are homologs beginning with the same letters and ellipses indicate the presence of more results (see Data S3 for full names and all detected genes).
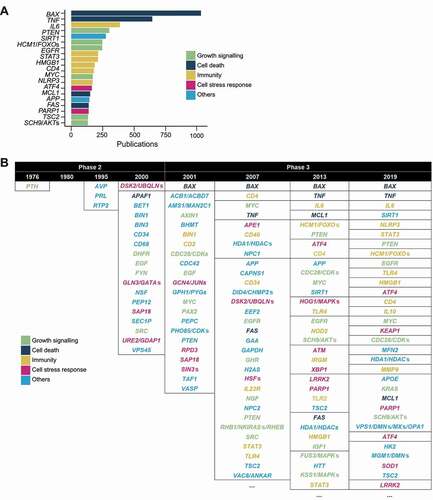
Figure 5. The scientific entities most mentioned in autophagy publications. (A) A scheme illustrating how entities were detected using the Python package scispaCy. Repeats were removed, leaving unique entities for each document (the title and abstract of a publication). (B) The top 20 entities. (C) The top 10 most frequently occurring entities for selected years of the 3 phases are indicated (see Data S5 for more).
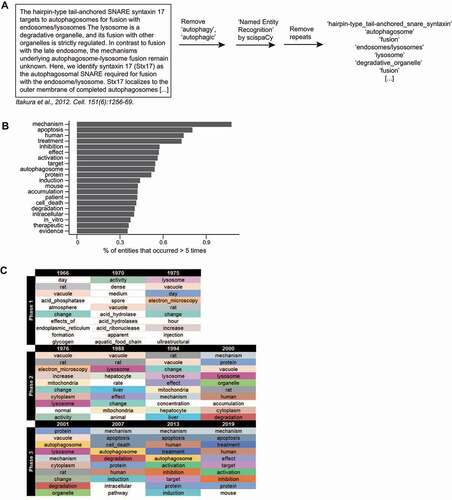
Figure 6. The topics in the autophagy research field. (A) A scheme illustrating how the LDA model was obtained. The top 20 terms for the topics in each model can be found in Data S6. (B) A t-SNE plot showing the probabilities of each publication assignment and that they are gathered into 17 clusters (“topics”). (C) A table containing the proposed titles of the 17 topics and the top 10 terms of each topic. (D) The publication count of each topic, corresponding to those in (C), was plotted over time as a line graph (left) and as a stacked bar graph, where it is displayed as a percentage of total number of studies for each year (right).
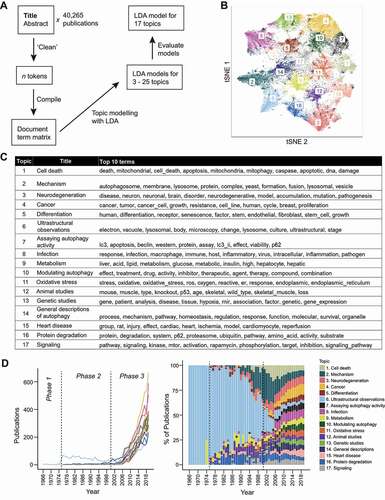
Figure 7. The frequency of MeSH disease descriptors in autophagy research field. (A) The ranking of the subcategories of MeSH Category C (“Disease”). (B) Wordclouds of the top 50 MeSH descriptors of each of the top 5 disease types. (See Data S7.).
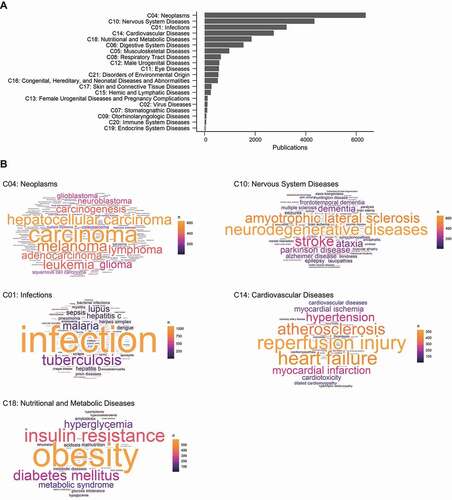
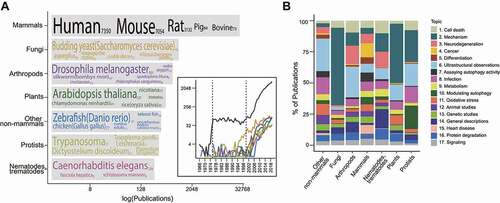
Figure 8. Topics in non-mammalian autophagy research. (A) The number of publications for each taxonomic category. The top 5 frequently occurring species, where available, are indicated with font size corresponding to their publication count (indicated in parenthesis following each species name). (B) The topics (found in ) present in each taxonomic category. (See Data S1 for classification.).