
Figures & data
Figure 1. The histogram of the LASSO logistic regression weights represents the importance of each feature for the classification task, (A) The positive weights reflect a susceptible behavior of the features to the target COVID-19 disease, whereas the negative weights a protective action. (B) Cross-validation ROC-AUC score for the grid of LASSO regularization parameters; the error bar is given by the standard deviation of the score within the 10 folds; the optimal regularization parameter is chosen by selecting the one with highest cross-validation score (red point). (C) Boxplot of accuracy, precision, sensitivity, specificity, and ROC-AUC score for the 10-fold of the cross-validation. The box extends from the Q1 to Q3 quartile, with a line at the median (Q2) and a triangle for the average. (D) Confusion matrix for the aggregation of the logistic regression predictions in the 10 folds of the cross-validation. (E) ROC curve for the 10 folds of the cross-validation. (F) Distribution of carriers of the polymorphism L412F in homozygous or heterozygous states stratified by clinical category.
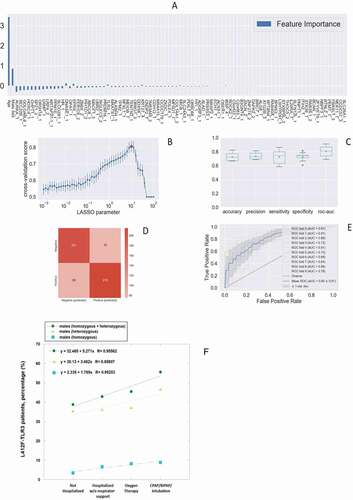
Table 1. L412F and COVID-19 outcome (both sexes).
Table 2. L412F and COVID-19 outcome (males only).
Table 3. L412F and COVID-19 outcome (females only).
Figure 2. Superposition of wild-type and mutated TLR3 protein. (A) TRL3 human protein tridimensional structure of 2Z7X crystal structure. In green cartoon representation of TLR3 protein. (B) and (C) Zoom of the mutated region with Leu412 in red sticks and Phe412 in magenta. The hydrophobic core of Leu377, Leu389, and Trp386 is in blue sticks.
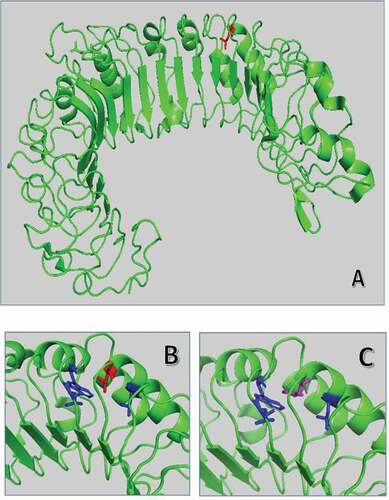
Figure 3. Analysis of autophagy in TLR3_L412F-expressing cells. (A) 28-day survival study of TLR3- L412F carriers vs not-carriers in the group treated with hydroxychloroquine. N = 156, with 73 carriers of TLR3- L412F. Three carriers and 1 not-carrier died in the first 28 days of treatment. (B) Analysis of autophagy in HEK-KO cells expressing wild type or L412F mutant proteins. HEK-KO cells were transfected for 24 h with plasmids encoding TLR3_WT and TLR3_L412F. Cells were next incubated in full medium (FM) or FM + 400 nM bafilomycin A1 (BAF A1) for 3 h and stimulated for increasing times with 50 μg/ml poly(I:C), as indicated. Cells were next fixed, permeabilized with 100 μg/ml digitonin and stained with anti-LC3B antibodies and revealed with Alexa Fluor 488-conjugated secondary antibodies. Nuclei were stained with DAPI. Where indicated, RAP (500 nM, for 2 h) was used as positive control for induction of autophagy. (C) Same as in B, but the amount of autophagosomes (scored as LC3B-positive dots) per cell was quantified by Volocity software. Measures were obtained by analyzing at least 400 cells/sample from 3 different experiments (n = 3). (D) Analysis of TNF mRNA expression in HEK-KO cells expressing wild type or L412F mutant proteins. HEK-KO cells were transfected for 24 h with plasmids encoding empty vector (CTR), TLR3_WT and TLR3_L412F and next stimulated for increasing times with 50 μg/ml poly(I:C), where indicated. TNF levels were evaluated by Real Time PCR. The gene expression levels were evaluated by the fold change versus TLR2 WT sample using the equation 2−DDCt. Data are presented as the mean ± SEM. Data significance was analyzed using One-way ANOVA test with Holm-Sidak’s correction. Asterisks were attributed for the following significance values: P > 0.05 (ns), P < 0.05 (*) and P < 0.01 (**). (E) Normal human fibroblasts (NDHF) from subjects expressing the TLR3_WT receptor were stimulated with 50 μg/ml poly(I:C) or RAP (1 μ M) for 4 h, in full medium alone or containing 400 nM bafilomycin A1 for 3 h. Cells were next fixed, permeabilized with 100 μg/ml digitonin and stained with anti-LC3B antibodies and revealed with Alexa Fluor 488-conjugated secondary antibodies. Nuclei were stained with DAPI. (F) Same as in E, but the number of autophagosomes (scored as LC3B-positive dots) per cell was evaluated for each sample by Volocity software. (G and H) same as in E-F, but fibroblasts are homozygous for the TLR3_L412F receptor. Statistical analysis was performed using Student’s t test. Means § SEM for each value are shown in the graphs. ns = not significant; ** = p < 0.01; *** = p < 0.001. < 0.001.
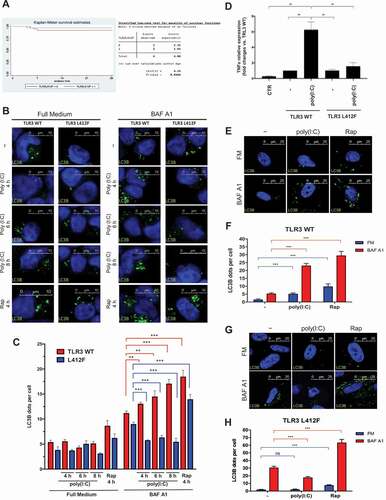
Table 4. Association between DR3-DQ2 + L412F haplotype and autoimmune disorders in male patients.
Table 5. Male patients with L412F and HLA DR3/DQ2 haplotype.