Figures & data
Figure 1. ALDOA maintained NLRP3 inflammasome activation. (A-E) ELISA of IL1B in supernatants of J774A.1 cells. (A) Various glycolytic intermediates (200 μM) as indicated were individually added to the 2-h glucose-starved J774A.1 cells pre-incubated with SLO for 5 min. (B) FBP, G3P or DHAP (200 μM) were individually added to the glucose-rich J774A.1 cells pre-incubated with SLO for 5 min. (C) Glucose, G3P, or FBP were added to the 2 h glucose-starved J774A.1 cells pre-incubated with SLO for 5 min. (D) G3P, or FBP were added to the 2 h glucose-starved J774A.1 cells stably expressing shRNA against Aldoa pre-incubated with SLO for 5 min. (E) ELISA of IL1B in supernatants of LPS-primed J774A.1 cells stably expressing shRNA against Aldoa, stimulated with ATP (5 mM) for 1 h, nigericin (4 μM) for 3 h, MSU (150 μg/ml) for 6 h. (F) Immunoblot analysis of IL1B and CASP1 in supernatants (SN) and extracts (Input) of LPS-primed J774A.1 cells stably expressing shRNA against Aldoa, stimulated as above. (G) Flow cytometry analysis (top) and quantification (bottom) of mitochondrial ROS by MitoSOX staining in LPS-primed J774A.1 cells stably expressing shRNA against Aldoa, stimulated as above. (H) Flow cytometry analysis (top) and quantification (bottom) of mitochondrial status in LPS-primed J774A.1 cells stably expressing shRNA against Aldoa, stimulated as above. Gates represent cells with damaged mitochondria. Data are presented as mean ± SD (n = 3). *P < 0.05, **P < 0.01.
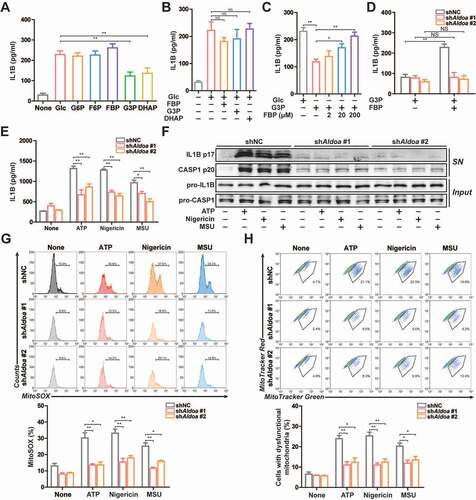
Figure 2. ALDOA limited PRKN-dependent mitophagy. (A) FACS analysis LPS-primed J774A.1 cells stably expressing shRNA against Aldoa and mito-Keima, stimulated with or without ATP (5 mM) for 0.5 h and 1 h. (B) FACS analysis LPS-primed J774A.1 cells stably expressing shRNA against Aldoa and mito-Keima, stimulated with or without nigericin (4 μM) for 1.5 h and 3 h. (C) FACS analysis LPS-primed J774A.1 cells stably expressing shRNA against Aldoa and mito-Keima treated with CQ (50 μM), stimulated with nigericin (4 μM) for 3 h. (D and E) Intracellular distribution of SQSTM1 (D) or LC3 (E) and mitochondria (TOMM20) in LPS-primed J774A.1 cells stably expressing shRNA against Aldoa, stimulated with ATP (5 mM) for 1 h, nigericin (4 μM) for 3 h, examined by confocal microscopy. Scale bars: 10 µm. Data are presented as mean ± SD (n = 3). *P < 0.05, **P < 0.01.
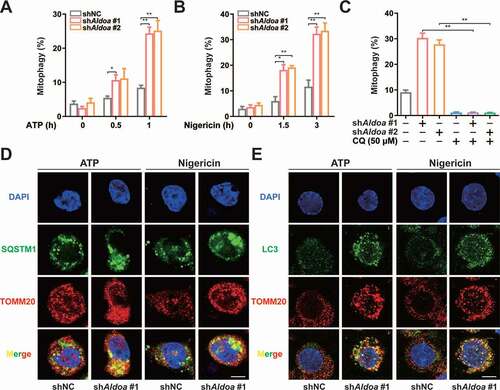
Figure 3. ALDOA controlled NLRP3 inflammasome activation by restricting PRKN-dependent mitophagy. (A) Flow cytometry analysis (left) and quantification (right) of mitochondrial ROS by MitoSOX staining in LPS-primed J774A.1 cells stably expressing shRNA against Aldoa and Atg5 or Sqstm1, stimulated with nigericin (4 μM) for 3 h. (B) Immunoblot analysis of IL1B and CASP1 in supernatants (SN) and extracts (Input) of LPS-primed J774A.1 cells stably expressing shRNA against Aldoa and Atg5 or Sqstm1, stimulated with nigericin (4 μM) for 3 h. (C) Flow cytometry analysis (left) and quantification (right) of mitochondrial ROS by MitoSOX staining in LPS-primed J774A.1 cells stably expressing shRNA against Aldoa and Prkn, stimulated with nigericin (4 μM) for 3 h. (D) Immunoblot analysis of IL1B and CASP1 in supernatants (SN) and extracts (Input) of LPS-primed J774A.1 cells stably expressing shRNA against Aldoa and Prkn, stimulated with ATP, nigericin or MSU. (E) Flow cytometry analysis quantification of mitochondrial ROS by MitoSOX staining in LPS-primed J774A.1 cells stably expressing shRNA against Aldoa and Calcoco2 or Optn, stimulated with nigericin (4 μM) for 3 h. (F) ELISA of IL1B in supernatants of LPS-primed J774A.1 cells stably expressing shRNA against Aldoa and Calcoco2 or Optn, stimulated with nigericin (4 μM) for 3 h. Data are presented as mean ± SD (n = 3). *P < 0.05, **P < 0.01.
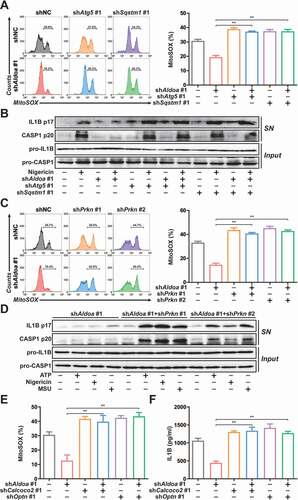
Figure 4. ALDOA controlled the initiation of mitophagy and NLRP3 inflammasome activation by restricting AMPK activation. (A) GSEA analyses of MTORC1 signaling gene sets (top) and AMPK-regulated MTOR gene sets (bottom) in J774A.1 cells stably expressing Aldoa shRNA vs nonspecific control shRNA. (B) Immunoblot analysis of p-EIF4EBP1 (Ser65), EIF4EBP1, p-RPS6KB1/S6K1 (Thr389) and RPS6KB1/S6K1 in J774A.1 cells stably expressing shRNA against Aldoa. (C) Immunoblot analysis of p-PRKAA/AMPKα (Thr172), PRKAA/AMPKα, p-ULK1 (Ser555), ULK1, p-ACACA/ACC (Ser79) and ACACA/ACC in J774A.1 cells stably expressing shRNA against Aldoa. (D) Immunoblot analysis of p-ULK1 (Ser555), ULK1 and LC3 in J774A.1 cells stably expressing shRNA against Aldoa and Prkaa (left) or shRNA against Aldoa treated with compound C (right). (E) FACS analysis LPS-primed J774A.1 cells stably expressing mito-Keima and shRNA against Aldoa and Prkaa (left) or shRNA against Aldoa treated with compound C (right), stimulated with nigericin (4 μM) for 3 h. (F and G) Intracellular distribution of SQSTM1 (F) or LC3 (G) and mitochondria (TOMM20) in LPS-primed J774A.1 cells stably expressing shRNA against Aldoa and Prkaa, stimulated with nigericin (4 μM) for 3 h, examined by confocal microscopy. Scale bars: 10 µm. (H) Immunoblot analysis of IL1B and CASP1 in supernatants (SN) and extracts (Input) of LPS-primed J774A.1 cells stably expressing shRNA against Aldoa and Prkaa, stimulated with ATP (5 mM) for 1 h, nigericin (4 μM) for 3 h, MSU (150 μg/ml) for 6 h. Data are presented as mean ± SD (n = 3). **P < 0.01.
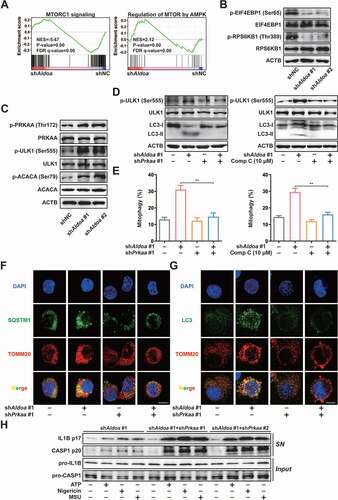
Figure 5. ALDOA involved in AMPK-activation complex formation. (A) Immunoblot analysis of STK11/LKB1, AXIN, PRKAA/AMPKα and LAMTOR1 in LAMTOR1 immunoprecipitates and total cell lysate (TCL) of J774A.1 cells stably expressing shRNA against Aldoa. (B) Immunoblot analysis of STK11/LKB1, AXIN, PRKAA/AMPKα, LAMTOR1 and ALDOA in LAMTOR1 immunoprecipitates and TCL of J774A.1 cells stably expressing Aldoa shRNA and ALDOA WT, D34S, R43A, K147Q, E188Q, or K230A variant cDNA. (C) Immunoblot analysis of p-PRKAA/AMPKα (Thr172), PRKAA/AMPKα, p-ULK1 (Ser555), ULK1, p-ACACA/ACC (Ser79), ACACA/ACC and ALDOA in J774A.1 cells stably expressing Aldoa shRNA and ALDOA WT, D34S, R43A, K147Q, E188Q, or K230A variant cDNA. (D) Immunoblot analysis of STK11/LKB1, AXIN, PRKAA/AMPKα, LAMTOR1 and ALDOA in LAMTOR1 immunoprecipitates and TCL of HEK293T cells expressing FLAG-ALDOA WT, D34S, R43A, K147Q, E188Q, or K230A variant cDNA. (E) Immunoblot analysis of p-PRKAA/AMPKα (Thr172), PRKAA/AMPKα, p-ULK1 (Ser555), ULK1, p-ACACA/ACC (Ser79), ACACA/ACC and FLAG in HEK293T cells expressing FLAG-ALDOA WT, D34S, R43A, K147Q, E188Q, or K230A variant cDNA. (F) Immunoblot analysis of IL1B and CASP1 in supernatants (SN) and extracts (Input) of LPS-primed J774A.1 cells stably expressing Aldoa shRNA and ALDOA WT, D34S, R43A, K147Q, E188Q, or K230A variant cDNA, stimulated with nigericin (4 μM) for 3 h. (G) a schematic diagram depicting formation of AMPK lysosomal supercomplex. Data are presented as mean ± SD (n = 3).
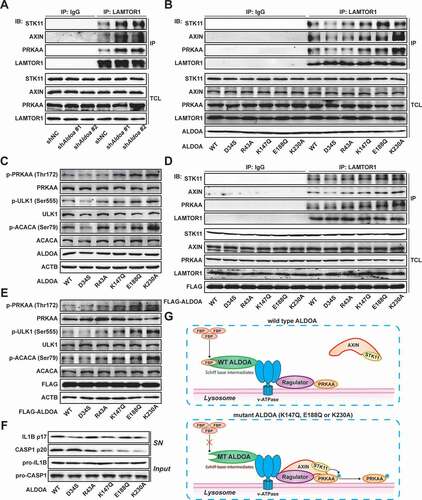
Figure 6. ALDOA restricted SQSTM1 transcription by controlling AMPK-FOXO3 signaling. (A) Quantitative real-time PCR analysis of SQSTM1 mRNA in J774A.1 cells stably expressing Aldoa shRNA, stimulated with Actinomycin D (10 μM) for different time. (B) Quantitative real-time PCR analysis of SQSTM1 mRNA in J774A.1 cells stably expressing shRNA against Aldoa and Atg5 or Prkaa. (C) Schematic representation of the different luciferase reporter constructs of the 5ʹ deletions SQSTM1 promoter. (D and E) Analysis of SQSTM1 promoter in response to ALDOA knockdown. The different 5ʹ deletions of the SQSTM1 promoter luciferase reporter constructs were transfected into MEFs cells stably expressing Aldoa shRNA and luciferase activity was measured as described. (F) Transcription factors enriched for the ALDOA knockdown-upregulated genes identified by promoter binding site analysis. (n = 782 upregulated genes). (G) Heatmap of FOXO3 regulated genes from three independent samples in J774A.1 cells stably expressing Aldoa shRNA vs nonspecific control shRNA. Gene expression values were colored red for high abundance and blue for low abundance. (H) GSEA analyses of FOXO3 signaling gene sets in J774A.1 cells stably expressing Aldoa shRNA vs nonspecific control shRNA. (I) Sequence logo of FOXO3 reverse complement (top). Schematic representation of the different luciferase reporter constructs of the SQSTM1 promoter mutants (bottom). (J) Analysis of SQSTM1 promoter specific mutants in response to ALDOA knockdown. The specific mutants of the SQSTM1 promoter luciferase reporter constructs were transfected into MEFs cells stably expressing Aldoa shRNA and luciferase activity was measured. (K) Chromatin from J774A.1 cells stably expressing shRNA against Aldoa and Prkaa was analyzed for recruitment of FOXO3 to the regulatory region of the SQSTM1 promoter by ChIP-qPCR. (L) Immunoblot analysis of p-FOXO3 (Ser413) and FOXO3 in J774A.1 cells stably expressing shRNA against Aldoa and Prkaa. Data are presented as mean ± SD (n = 3). *P < 0.05, **P < 0.01.
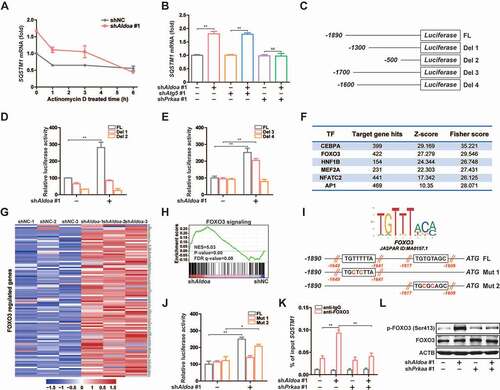
Figure 7. Chemical screening and identification of LYG-202 directly bound to ALDOA. (A) ALDOA enzyme activity was detected by adding various flavonoids individually (10 μM). (B) ALDOA enzyme activity was detected by adding various synthetic derivatives of wogonin individually (4 μM). (C) FBP aldolase activity was detected in J774A.1 cells treated by 1, 2, 4 μM of LYG-202. (D) CETSA melt curve of ALDOA for heat treatment of differentiated THP-1 cells and J774A.1 cells in the absence and in the presence of LYG-202 (4 μM). (E) Drug concentration dependence isometric line of ALDOA in the presence of increasing concentrations of LYG-202 in differentiated THP-1 cells and J774A.1 cells. (F) The interaction between LYG-202 and human (Hs) ALDOA or mouse (Mm) ALDOA was detected by MST. (G) Immunoblot analysis of ALDOA in differentiated THP-1 cells and J774A.1 cells treated by 1, 2, 4 μM of LYG-202 and pronase (1:100). (H) Molecular docking analysis of LYG-202 and ALDOA in the absence (left) and in the presence of FBP (right). Data are presented as mean ± SD (n = 3). *P < 0.05, **P < 0.01 compared with DMSO group.
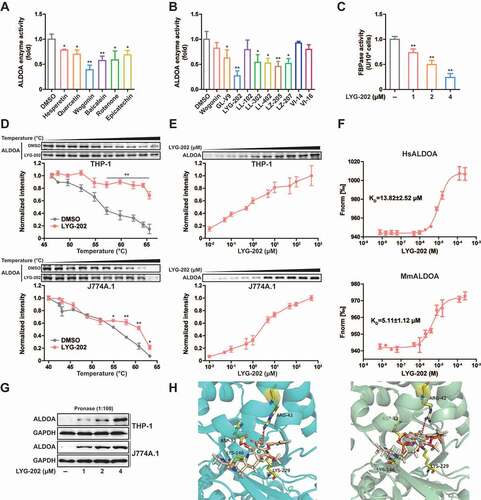
Figure 8. LYG-202 suppressed NLRP3 inflammasome activation. (A and B) ELISA of IL1B in supernatants of LPS-primed differentiated THP-1 cells (A) and J774A.1 cells (B) treated with 4 μM of LYG-202, followed by stimulation with ATP (5 mM) for 1 h, nigericin (4 μM) for 3 h, MSU (150 μg/ml), MDP (200 ng/ml) or flagellin (200 ng/ml) for 6 h, or transfection of poly(dA:dT) (1 μg/ml) for 8 h. (C) ELISA of IL1B in supernatants of BMDMs treated with 4 μM of LYG-202, followed by stimulation with ATP (5 mM) for 1 h, nigericin (4 μM) for 3 h, MSU (150 μg/ml) for 6 h. (D-F) Immunoblot analysis of IL1B and CASP1 in supernatants (SN) and extracts (Input) of LPS-primed differentiated THP-1 cells (D), J774A.1 cells (E) and BMDMs (F) treated as above. (G) Flow cytometry analysis (top) and quantification (bottom) of mitochondrial ROS by MitoSOX staining in LPS-primed J774A.1 cells treated with 4 μM of LYG-202, followed by stimulation with ATP, nigericin, or MSU. (H) Flow cytometry analysis (top) and quantification (bottom) of mitochondrial status in LPS-primed J774A.1 cells treated as above. Gates represent cells with damaged mitochondria. (I) Flow cytometry analysis of mitochondrial membrane potential by JC-1 staining in LPS-primed J774A.1 cells treated as above. (J) Quantitative real-time PCR analysis of mtDNA released from LPS-primed J774A.1 cells treated as above. Data are presented as mean ± SD (n = 3). *P < 0.05, **P < 0.01.
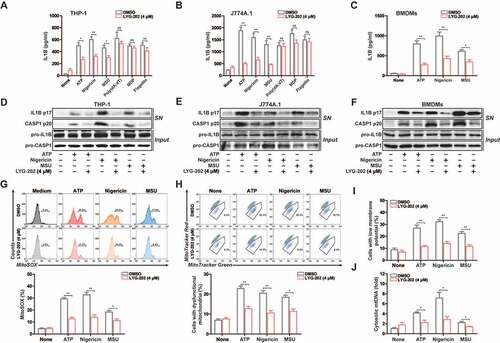
Figure 9. LYG-202 initiated mitophagy by activating AMPK to inhibit the NLRP3 inflammasome. (A) FACS analysis LPS-primed J774A.1 cells expressing mito-Keima treated with 4 μM of LYG-202, followed by stimulation with nigericin. (B and C) Quantification of cells (B) with SQSTM1 aggregation on mitochondria and Intracellular distribution (C) of SQSTM1 and mitochondria (TOMM20) in LPS-primed J774A.1 cells treated with 4 μM of LYG-202, followed by stimulation with nigericin, examined by confocal microscopy. Scale bars: 10 µm. (D) Immunoblot analysis of IL1B and CASP1 in supernatants (SN) and extracts (Input) of LPS-primed J774A.1 cells stably expressing Atg5 shRNA, which treated with 4 μM of LYG-202, followed by stimulation with nigericin. (E) Quantification of MitoSOX staining in LPS-primed J774A.1 cells stably expressing Atg5 shRNA, which treated with 4 μM of LYG-202, followed by stimulation with nigericin. (F) Immunoblot analysis of IL1B and CASP1 in supernatants (SN) and extracts (Input) of LPS-primed J774A.1 cells stably expressing Sqstm1 shRNA, which treated with 4 μM of LYG-202, followed by stimulation with nigericin. (G) Quantification of MitoSOX staining in LPS-primed J774A.1 cells stably expressing Sqstm1 shRNA, which treated with 4 μM of LYG-202, followed by stimulation with nigericin. (H) Immunoblot analysis of p-PRKAA/AMPKα (Thr172), PRKAA/AMPKα, p-ULK1 (Ser555), ULK1, p-ACACA/ACC (Ser79), ACACA/ACC, p-EIF4EBP1 (Ser65), EIF4EBP1, p-RPS6KB1/S6K1 (Thr389) and RPS6KB1/S6K1 in J774A.1 cells treated with 1, 2, 4 μM of LYG-202. (I) Immunoblot analysis of STK11/LKB1, AXIN, PRKAA/AMPKα and LAMTOR1 in LAMTOR1 immunoprecipitates and total cell lysate (TCL) of J774A.1 cells treated with 4 μM of LYG-202. (J) Immunoblot analysis of SQSTM1 and LC3 (right) in J774A.1 cells stably expressing Prkaa shRNA, which treated with 4 μM of LYG-202. (K) Immunoblot analysis of IL1B and CASP1 in supernatants (SN) and extracts (Input) of LPS-primed J774A.1 cells stably expressing Prkaa shRNA, which treated with 4 μM of LYG-202, stimulated with nigericin. Data are presented as mean ± SD (n = 3). **P < 0.01.
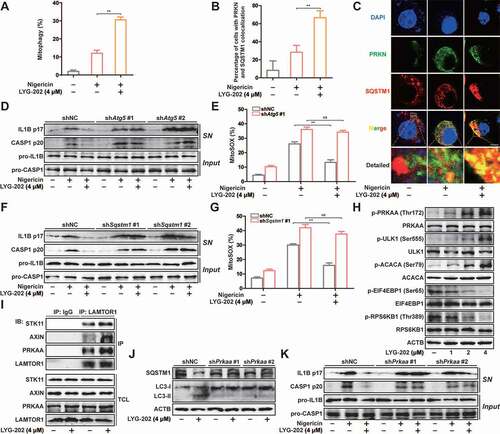
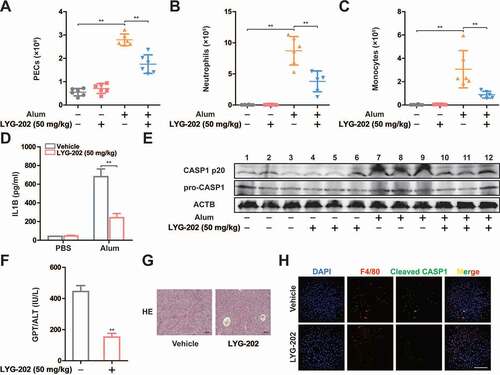
Figure 10. LYG-202 inhibited NLRP3 inflammasome-dependent sterile inflammation and fulminant hepatitis. (A-C) Alum-induced peritoneal infiltration of PEC (A), neutrophils (ITGAM/CD11b+ LY6G+ ADGRE1/F4/80−) (B), and monocytes (ITGAM/CD11b+ LY6C+ LY6G−) (C) in mice 16 h after alum or PBS injection. (D) Peritoneal IL1B in mice 16 h after alum or PBS injection. (E) Immunoblot analysis of CASP1 activation in PECs 16 h after alum or PBS injection. (F) Serum concentrations of GPT/ALT in mice after LPS plus D-gal challenge. (G) Representative liver histology in mice after LPS plus D-gal challenge. (H) Fluorescent staining of ADGRE1/F4/80, Cleaved CASP1, and DAPI in livers of mice after LPS plus D-gal challenge. Data are presented as mean ± SD (n = 6). **P < 0.01.