Figures & data
Figure 1. SH3BGRL upregulation is associated with the poor prognosis of breast cancer. (A,B) SH3BGRL upregulation in breast cancer tissues, compared with the paired normal tissues based on TCGA dataset. Tumor (T) = 111, Normal (N) = 111; Ratio of SH3BGRL in tumor to normal (T:N) is 1.52; P < 0.0001 (A) and GSE26304 dataset (T = 109, N = 6; T:N = 1.8; P = 0.03) (B) analyses. (C,D) Kaplan–Meier analysis of overall survival (C, n = 1075; P = 0.003) or relapse-free survival (D, n = 1119; P = 0.0078) of breast cancer patients with low versus high SH3BGRL expression from two TCGA datasets. (E,F) Kaplan–Meier analysis of overall survival of cases from GSE26304 dataset (n = 109; P < 0.0001) (E) or Kaplan-Meier Plotter Tang_2018 dataset (n = 65; P = 0.0061) (F) of breast cancer patients with low versus high SH3BGRL expression. (G,H) Immunoblots of SH3BGRL in 12 pairs of breast cancer samples and matched adjacent normal tissues (G), and in MCF-10A and 8 cultured breast cancer cell lines (H). ACTB served as the loading control. (I,J) IHC staining of SH3BGRL expression in 25 paired human breast cancer tissues, compared with their adjacent normal ones (I). Statistical SH3BGRL expression is shown (J). Scale bars are shown; P < 0.0001.
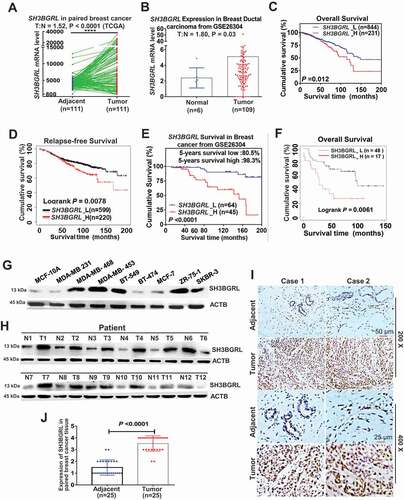
Figure 2. SH3BGRL confers resistance to doxorubicin (Dox)-induced apoptosis through autophagy. (A) GSEA enrichment analysis of SH3BGRL expression and Dox resistance signature in public breast datasets (GSE45827,n = 130; GSE26304, n = 109) and MDA-MB-453 cells. (B) GSEA plots of SH3BGRL expression with autophagy gene signatures in public breast cancer datasets GSE45827(n = 130) and GSE15852 (n = 41). (C) IC50 of Dox in the indicated cells under combined treatment with CQ or without CQ. (D) Flow cytometry analyses of MCF-7 cells with SH3BGRL overexpression or MDA-MB-453 cells with SH3BGRL knockdown with their parental control cells treated with indicated concentrations of Dox and time with or without CQ. The left panels show the staining of ANXA5-FITC and PI, and the right ones present the quantification of apoptotic cells. (E) Colony formation of the cells as shown in (D) with treatments of Dox combined with CQ or 3-MA or without them (Control), respectively. The upper panels show representative images of generated colonies. Each experiment was independently repeated three times. (F-H) Xenograft model of MCF-7 and MDA-MB-453 tumor cells for tumor progression in nude mice. The growth curves of each tumor progression were measured by tumor volume (F), mean tumor weight of the dissected tumors after five weeks of tumor growth (G) and their weight statistical analysis (H). Six nude mice in each group were subcutaneously injected with indicated cells for 1 week, and the Dox treatment was conducted. All statistical analyses are shown as *P < 0.05, **P < 0.01, ***P < 0.001, ****P < 0.0001 and n.s, no significance, respectively.
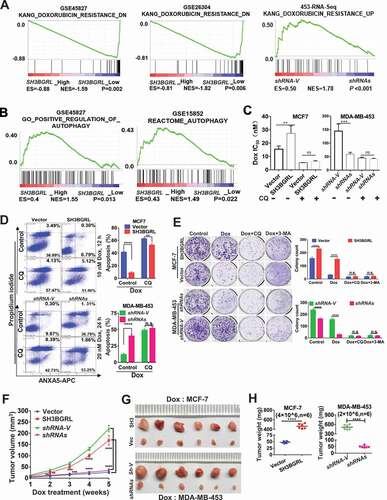
Figure 3. SH3BGRL promotes autophagy flux in breast cancer cells.(A-C) Immunoblots of SQSTM1, LC3B-I and LC3B-II in indicated cells with or without Dox treatment (A). ACTB was used as an internal loading control. Statistical analyses of SQSTM1 expression (B) and LC3B-II:LC3B-I ratio(C) in indicated cells. ***P < 0.001, ****P < 0.0001, n.s., no significance. (D) Immunoblots of SQSTM1, LC3B-I and LC3B-II in indicated cells. Cells were pretreated with 50 nM Baf A1 for 4 h and cultured in either normal culture medium (upper panel, Normal) or EBSS medium (lower panel, EBSS) for another 2 h, respectively. ACTB was used as an internal loading control. (E) Immunoblots of autophagy-related proteins and the cleaved c-CASP3 in MCF-7 SH3BGRL overexpressing cells or MDA-MB-453 SH3BGRL knockdown cells. Cells were treated with Dox along with or without 50 nM BafA1 for 4 h. (F,G) Representative immunofluorescence staining of LC3B puncta in indicated cells with Serum-free medium (F) for 12 h or EBSS culture for 6 h (G). Cells were counterstained with DAPI in blue. Bars: 25 μm. (H) Quantifications of LC3B puncta intensity in the assayed cells (F,G) were presented as histograms. ***P < 0.001, ****P < 0.0001.
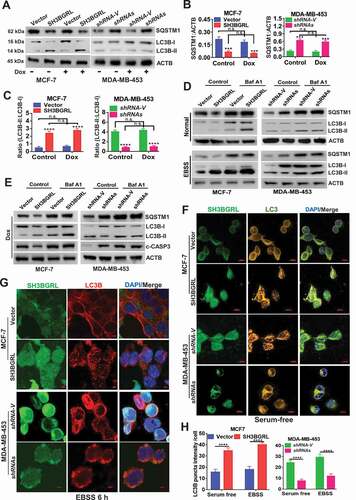
Figure 4. SH3BGRL renders autophagy of breast cancers. (A) Immunoblots of SQSTM1 protein in the MCF-7 cells with SH3BGRL overexpression or MDA-MB-453 cells with SH3BGRL knockdown, respectively. Cells were treated with or without 0.5 µg/ml actinomycin D (Act D), 50 μg/ml cycloheximide (CHX), 20 μM MG132, or 50 μM CQ for 12 h, respectively. (B) Immunoblots of MTOR and its phosphorylated form in the indicated cells. (C,D). Representative IHC staining of total LC3B protein expression in 25 paired human breast cancer tissues compared with adjacent normal ones (C) Scale bars: 100 mm (insets, 50 mm). Statistical LC3B expression is shown (D), P = 0.0109. (E) Correlation analysis of SH3BGRL expression level with that of LC3B in breast cancer tissues. (n = 25; r = −0.56; P = 0.0034).
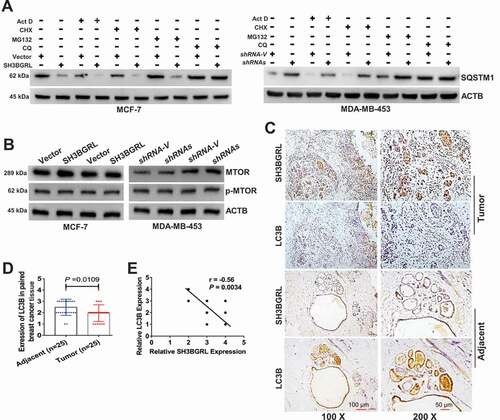
Figure 5. SH3BGRL drives autophagy through PIK3C3 translation by interaction ribosome. (A) GST affinity isolation of SH3BGRL with ribosomal subunits. GST affinity isolation was performed with lysates of MCF-7 and MDA-MB-453 cells, followed by MS peptide sequencing. (B) Heatmap of RNA-seq and Polyribosome-profile analyses of ULK1, PIK3C3, BECN1, ATG7, ATG5, ATG3, MAP1LC3B and SQSTM1. (C) Immunoblots of SH3BGRL and PIK3C3 in indicated cells. ACTB was used as an internal loading control. Statistical analysis of PIK3C3 expression in indicated cells by four independent immunoblots. (D) Immunoblots of PIK3C3 protein in the indicated cells treated with or without 50 μg/ml cycloheximide (CHX) for 6 h. PIK3C3 expression was statistically analyzed based on three independent experiments. (E,F) Polyribosome profiling of PIK3C3 mRNA in MCF-7 (E) or MDA-MB-453 (F) cells. ACTB was used as an internal negative loading control. The marked numbers are equivalent to the collected fractions after gradient centrifuge. Fraction 1 represents the top (10%) of the gradient, fraction 10 represents the bottom (50%) of the gradient. (G) Polyribosome profiling of ATG12 mRNA in indicated cells as (E). All experiments were independently repeated at least three times. (H) Immunoblots of ULK1, BECN1, ATG7, ATG5 and ATG3 in the indicated cells. ACTB was used as a loading control. All significant differences are shown as *P < 0.05, **P < 0.01, ***P < 0.001, ****P < 0.0001.
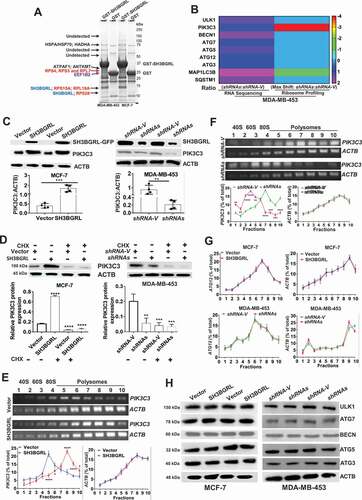
Figure 6. SH3BGRL also enhances autophagy through sustaining ATG12 stability. (A) Immunoblots of ATG12 in the indicated cells. ACTB was used as a loading control. Statistical analysis of ATG12 expression by four independent immunoblots. ***P < 0.001, ****P < 0.0001. (B) ATG12 protein stability analysis. Indicated cells were treated with 50 μg/ml cycloheximide (CHX) for 0, 3, 6, 9 h and the statistical analysis of ATG12 expression was conducted with three independent experiments. ***P < 0.001, ****P < 0.0001. (C) Co-immunoprecipitation of SH3BGRL and ATG12 in lysates of HEK293T, MCF-7, MDA-MB-231 and MDA-MB-453 cells. (D) Co-immunoprecipitation analysis of the interaction domain of SH3BGRL with ATG12 in 293 T and MCF-7 cells transfected with indicated SH3BGRL and truncated mutants, respectively. Cells were treated with MG132 for 12 h to block the degradation of ATG12. (E) Immunoblots of ATG12 in the indicated cells. Cells were treated with or without MG132 for 12 h. Statistical analysis of ATG12 expression was performed with three independent experiments. *P < 0.05, **P < 0.01. (F) Ubiquitination analysis of ATG12. Cells were treated with or without MG132 for 12 h. Lysates from Indicated cells were immunoprecipitated with ATG12 antibody, followed by immunoblotting analysis with antibody against ubiquitin.
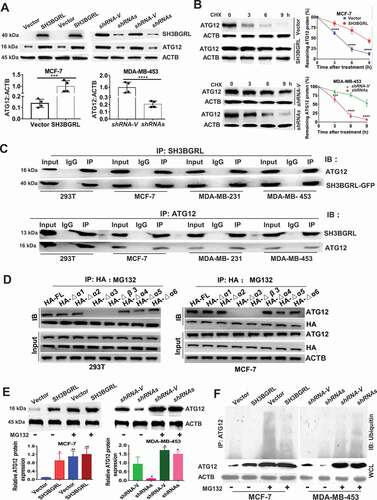
Figure 7. PIK3C3 and ATG12 contribute to SH3BGRL-mediated Dox resistance. (A,B) Immunoblots of PIK3C3 (A) and ATG12 (B) in indicated cells. ACTB served as the loading control. (C) Flow cytometry analysis of the indicated MCF-7 series cells. 10 nM or 20 nM Dox was used to treat MCF-7 or MDA-MB-453 cells for 12 h or 24 h, respectively. The left panel shows the staining of ANXA5-FITC and PI. The right panel is the quantification of apoptotic cells. (D) Immunoblots of the indicated autophagy markers in MCF-7-SH3BGRL overexpression cells with either ATG12 or PIK3C3 knockdown, or in MDA-MB-453-SH3BGRL knockdown cells with either ATG12 or PIK3C3 forced expression. (E) Immunoblots of SQSTM1 and the cleaved CASP3 in the above cells in (C). MCF-7 cells were treated with 10 nM Dox for 12 h, and MDA-MB-453 cells with 20 nM Dox for 24 h. (F) Representative images of colonies formed by indicated cells with10 nM or 20 nM Dox treatment. The right panel shows the quantification of colony formation. Colonies with more than 60 cells were scored. (G) Statistical SQSTM1 and the cleaved CASP3 expression by three independent experiments. 10 nM Dox was used for MCF-7 cells, and 20 nM for MDA-MB-453 cells. (H) Cell viability analysis of indicated cells under treatment with Dox at various concentrations, combined with or without CQ for 24 h. (I) IC50 of the indicated cells under treatment as in (D). (J) Representative images of soft agar colonies of the indicated cells after treatments with10 nM or 20 nM Dox treatment for 48 h (Left panel). Quantification of soft agar colony is shown in the right panel. Colonies (larger than 0.1 mm diameter) were quantified after 18 days of culture. Significant differences are shown as *P < 0.05, **P < 0.01, ***P < 0.001, ****P < 0.0001, and n.s means no significance.
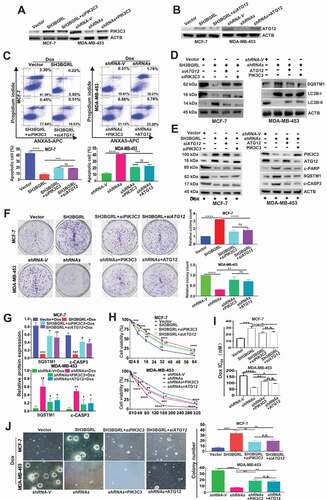
Figure 8. PIK3C3 and ATG12 contribute to tumorigenicity and Dox resistance. (A,B) Xenograft model of chemotherapy in nude mice. Six nude mice in each group were subcutaneously injected with indicated cells for 1 week, mice were treated with Dox combined with or without CQ for two weeks. Mean tumor weights were quantified around another three weeks later (B). ****P < 0.0001. (C) Immunoblots of SH3BGRL, PIK3C3, ATG12, SQSTM1, LC3B, PARP, cleaved (c)-PARP, CASP3 and c-CASP3 in the indicated mice tumor tissues. ACTB was used as a loading control. (D) Statistical analysis of SQSTM1, c-CASP3 and c-PARP expressions in the indicated six group mice tumors. Error bars represent mean ± s.d.*P < 0.05, **P < 0.01, ***P < 0.001. (E) Transcriptional expression analysis of classical genes involved in Dox resistance from RNA-Seq of MCF-7 and MDA-MB-453 cells with SH3BGRL expression alteration. (F) Translational expression analysis of general genes involved in Dox resistance based on polyribosome profiling results of MDA-MB-453 cells.
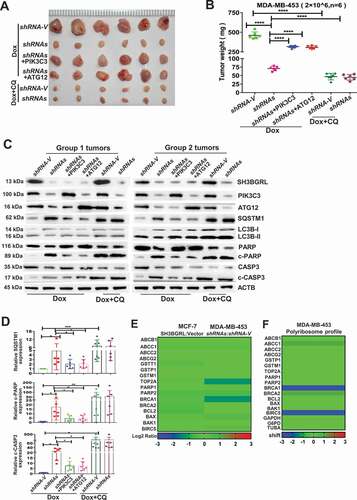
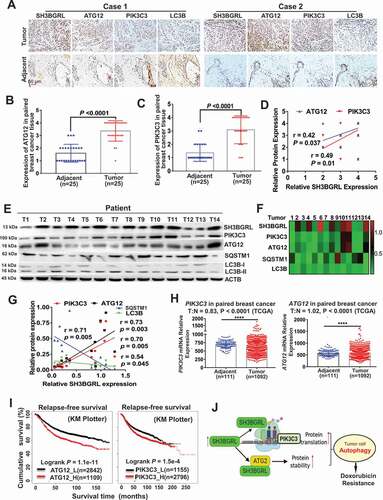
Figure 9. Activation of SH3BGRL-PIK3C3/ATG12 autophagy axis in breast cancer patients. (A). Representative IHC staining of SH3BGRL, ATG12, PIK3C3 and LC3B expressions in 25 primary breast cancer specimens along with the matched adjacent normal tissues. Scale bar: 50 µm. (B,C) Statistical analysis of ATG12 (B) and PIK3C3 (C) in tissues of (A). (D) Correlation analysis of SH3BGRL protein level to that of ATG12 (r = 0.42; P = 0.037) or PIK3C3 (r = 0.49; P = 0.01) in breast cancer tissues in (A). (E) Immunoblots of the indicated proteins in 14 fresh breast cancer specimens. ACTB was used as a loading control. (F) Heatmap of protein expression of SH3BGRL, PIK3C3, ATG12, SQSTM1, and LC3B protein band intensity in (E), which was quantified and analyzed with densitometry and Image J software. (G) Correlation analysis of SH3BGRL protein level with that of PIK3C3, ATG12, SQSTM1 or LC3B in (F). (H) Marginal elevation of PIK3C3 mRNA expression in breast cancer tissues, compared with normal breast tissues (T = 1092, N = 111;T:N = 0.83, P < 0.0001; TCGA) and ATG12 mRNA (T = 1092, N = 111;T:N = 1.02, P < 0.0001; TCGA). (I) Kaplan–Meier relapse-free survival curves of breast cancer patients based on mRNA of ATG12 (n = 3951; P = 1.1e-11) or PIK3C3 (n = 3951; P = 1.5e-4). (J) Schematic mechanism of SH3BGRL-PIK3C3/ATG12 autophagy on doxorubicin resistance in breast cancer. All statistical analyses are shown as ****P < 0.0001.