
Figures & data
Figure 1. Knockdown of ATG5 and BECN1 inhibited autophagy in GCs. The negative control siRNA (NC), ATG5 siRNA (siATG5), and BECN1 siRNA (siBECN1) were transfected into KGN cells, and 48 h later the knockdown efficiencies were determined in both mRNA (A) and protein (B) levels. GAPDH and ACTB/β-actin served as the internal control for mRNA and protein, respectively. Data are presented as mean ± SD, n = 3, *P < 0.05, **P < 0.01 vs. NC. (C) The expression of LC3 and SQSTM1 proteins in these three groups was detected by Western blot. ACTB was used as the loading control. Quantitative analysis showed lower LC3-II:LC3-1 ratios (D) and higher levels of SQSTM1 (E) in the siATG5 and siBECN1 groups, compared to the NC group. Data are presented as mean ± SD, n = 3, *P < 0.05, **P < 0.01. (F) KGN cells were transfected with NC, siATG5, and siBECN1 for 24 h, followed by infection with LC3 reporter adenovirus for 48 h. The distribution of green (GFP) LC3 puncta was observed under a fluorescence microscope after starvation for 6 h. Cell nuclei were counterstained with Hoechst 33342. Scale bar: 5 μm. (G) Quantification of green LC3 puncta in KGN cells of each group. Data are presented as mean ± SD, n = 3, ***P < 0.001.
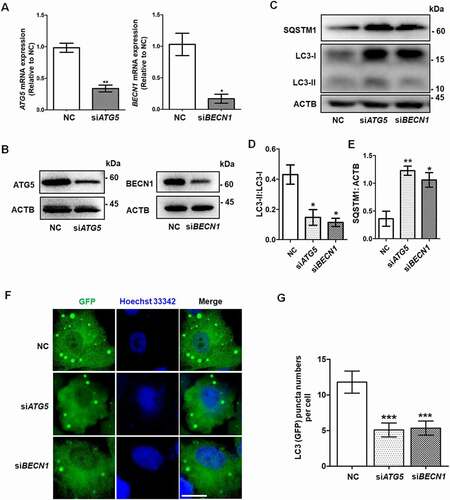
Figure 2. Autophagy inhibition leads to insufficient differentiation of GCs. (A) After siRNA transfection of KGN cells for 48 h, the mRNA expression of the genes related to GC differentiation and steroidogenesis, including CYP19A1, FSHR, GATA4, GATA6, INHBA, SF1, SP1, HSD3B1, and STAR, showed significant downregulation in both the siATG5 and siBECN1 groups. GAPDH served as the internal control. Data are presented as mean ± SD, n = 3, * P < 0.05, ** P < 0.01, ***P < 0.001. vs. NC. (B) After treatment of KGN cells with CQ, the mRNA expression of CYP19A1 and FSHR was downregulated compared to controls. GAPDH served as the internal control. Data are presented as mean ± SD, n = 3. ** P < 0.01 vs. CON. (C and D) Protein levels of CYP19A1 and FSHR were decreased in KGNs transfected with siATG5 and siBECN1 or pretreated with CQ as measured by Western blot. ACTB was used as the loading control. (E) E2 production in KGN cell supernatant was decreased in both the siATG5 (6.32 ± 1.41 ng/mg) and siBECN1 (8.81 ± 0.56 ng/mg) groups compared to the NC group (15.33 ± 0.36 ng/mg). Data are presented as mean ± SD, n = 3, **P < 0.01 vs. NC. (F) E2 production in CQ-treated KGN cells (7.96 ± 0.47 ng/mg) was lower than that in the control group (18.11 ± 1.10 ng/mg). Data are presented as mean ± SD, n = 3, **P < 0.01 vs. CON. (G) Mouse GCs were harvested and cultured in vitro. After 48 h treatment with 50 μM CQ, the protein levels of CYP19A1 and FSHR were lower than those in the control group. GAPDH was used as the loading control. (H) The E2 production was decreased in CQ-treated mouse GCs (0.12 ± 0.03 ng/mg) compared to the control group (0.82 ± 0.18 ng/mg). Data are presented as mean ± SD, n = 3, **P < 0.01 vs. CON.
Figure 3. Accumulation of WT1 in GCs results from autophagy inhibition. (A) Western blot showed that, compared to NC, there was an increase in WT1 protein in both the siATG5 and siBECN1 groups, but there were no significant changes in FOXO1 protein. GAPDH was used as the loading control. (B) The qRT-PCR results showed that, compared to NC, the WT1 mRNA did not change significantly and FOXO1 mRNA decreased in the siATG5 group, while both WT1 and FOXO1 mRNA decreased significantly in the siBECN1 group. Data are presented as mean ± SD, n = 3, *P < 0.05, **P < 0.01 vs. NC. (C) After 0 h, 2 h, 4 h, and 6 h of CHX treatment to inhibit protein synthesis, Western blot was performed to detect the remaining amount of WT1 protein in KGN cells transfected with NC, siATG5, and siBECN1. GAPDH was used as the loading control. (D) The results of the quantitative analysis showed that the degradation rate of the WT1 protein in the siATG5 and siBECN1 groups was significantly slower compared to the NC. Data are presented as mean ± SD, n = 3. (E) Compared to control, there was a significant increase in WT1 protein level in KGN cells treated with CQ, but no significant change in FOXO1 protein. GAPDH was used as the loading control. (F and G) The degradation rate of WT1 protein in KGN cells pretreated with CQ was also delayed significantly. GAPDH was used as the loading control. Data are presented as mean ± SD, n = 3. It was noted that because the CHX chase assay was carried out after 48 h of siRNA infection or CQ treatment, the WT1 and SQSTM1 proteins had already accumulated in the siRNA or CQ group at 0 h (C and F). (H) Compared to control, the WT1 protein in the nucleus was elevated in KGN cells pretreated with CQ. LMNB1 and GAPDH were used as the loading controls for the nuclear and cytoplasmic proteins, respectively.
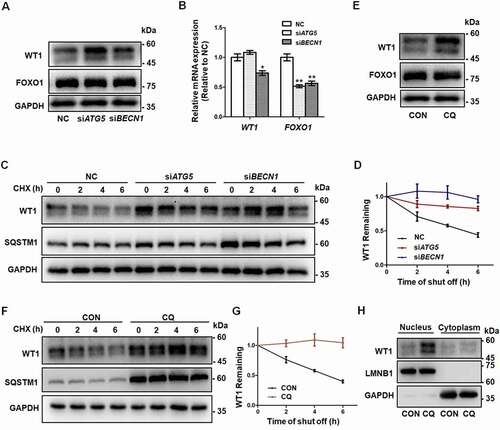
Figure 4. The degradation of WT1 occurs in an autophagy-dependent way. (A) Immunofluorescence staining of WT1 (red) and SQSTM1 (green) was performed in control and CQ and/or IVM-treated HEK293T cells transfected with Flag-WT1 plasmids. The nuclei were stained with DAPI (blue). Enlarged insets are marked by dashed boxes. Scale bar: 5 μm. (B) Sequence alignment of the LIR motifs of WT1 protein among species. The conserved residues in LIR motifs are shown by asterisks. (C) Wild-type (WT) and mutant WT1 (Y407A/L410A) plasmids were transfected into HEK293T cells for 48 h, and CHX chase assays were performed. The remaining amounts of WT1 protein were analyzed by Western blot. TUBA1B was used as the loading control. (D) Quantitative analysis of the degradation rates of WT and mutant (Mut) WT1 protein in HEK293T cells. Data are presented as mean ± SD, n = 3. (E) Wild-type (WT) or mutant (Mut) WT1 and GFP-LC3 plasmids were cotransfected into HEK293T cells. Cells were harvested for Co-IP assays and immunoprecipitated with anti-Flag antibody, and then WT1 and LC3 protein were detected by Flag and GFP antibodies by Western blot. IgG was used as the negative control. (F) Quantitative analysis of the amount of the co-immunoprecipitating between wild-type (WT) or mutant (Mut) WT1 and GFP-LC3. The immunoprecipitated GFP-LC3 was compared with the input. Data are presented as mean ± SD, n = 3, *P < 0.05.
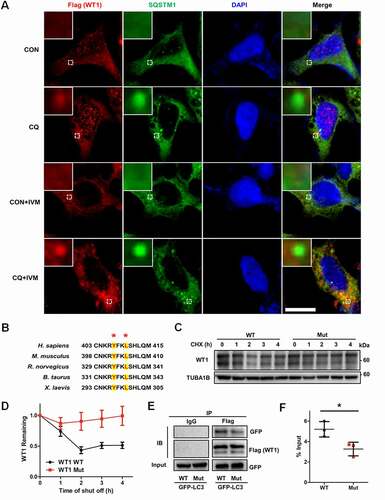
Figure 5. The accumulation of WT1 protein inhibits the differentiation of GCs. (A) Western blot showed that CYP19A1 and FSHR levels in KGN cells infected with adenovirus overexpressing WT1 (Adv-WT1) were significantly decreased. GAPDH was used as the loading control. (B) After incubation with 10 nM testosterone for 24 h, the E2 synthesis capacity of KGN cells overexpressing WT1 (6.30 ± 0.25 ng/mg) was significantly lower than that of the control group (15.21 ± 0.69 ng/mg). Data are presented as mean ± SD, n = 3, **P < 0.01 vs. Ad-CON. (C) Transfection with 100 nM WT1 siRNA (siWT1) resulted in a decreased WT1 mRNA level. GAPDH was used as the internal control. Data are presented as mean ± SD, n = 3, **P < 0.01 vs. NC. (D) Western blot showed that WT1 protein decreased significantly after siWT1 transfection, and the protein levels of CYP19A1 and FSHR were upregulated in siWT1 KGN cells. In siWT1 cells, after the subsequent treatment with 50 μM CQ for 48 h, the expression of WT1 was significantly lower than that in NC cells, and the levels of CYP19A1 and FSHR were elevated. ACTB was used as the loading control. (E) After 24 h incubation with 10 nM testosterone, the E2 synthesis ability of siWT1 KGN cells (24.70 ± 1.46 ng/mg) was significantly higher than that of NC cells (18.38 ± 1.35 ng/mg). After CQ treatment, the E2 synthesis ability of siWT1 KGN cells (8.52 ± 0.44 ng/mg) was significantly higher than that of NC cells (6.08 ± 0.67 ng/mg). Data are presented as mean ± SD, n = 3, *P < 0.05.
Figure 6. Autophagy inhibition delays GCs differentiation and increases WT1 in the ovaries of mice. Ovaries were dissected from mice with or without 5 days of 20 mg/kg CQ intraperitoneal injection. (A) Western blot showed that the protein levels of SQSTM1 and LC3-II were significantly increased in the ovaries of the mice injected intraperitoneally with CQ for 5 days. The expression of WT1 was increased and the differentiation markers CYP19A1 and FSHR were decreased compared to the controls. ACTB was used as the loading control. (B) Immunofluorescence showed the increased expression of WT1 (red) in the GCs of preantral follicles of mice treated with CQ. The nuclei were stained with DAPI (blue). Scale bars: 37.5 μm. (C) Serum E2 in CQ-treated mice (9.01 ± 1.13 pg/ml) was significantly lower than that in the control group (13.41 ± 0.58 pg/ml). Data are presented as mean ± SD, n = 5, *P < 0.05 vs. CON.
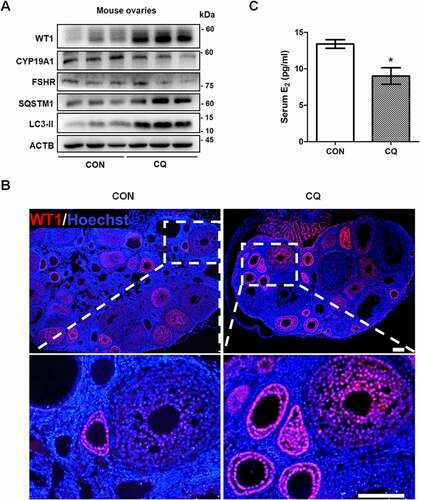
Figure 7. Activation of autophagy promotes differentiation in GCs. (A) Western blot showed that LC3-II:LC3-I in KGN cells pretreated with RAP was increased and SQSTM1 protein was decreased compared to the control group. GAPDH was used as the loading control. (B) After pretreatment with RAP, the expression of the differentiation markers CYP19A1 and FSHR was increased and WT1 protein was decreased. GAPDH was used as the loading control. (C) The E2 synthesis capacity of KGN cells treated with RAP (45.91 ± 1.91 ng/mg,) was significantly higher than that of the control group (35.76 ± 0.52 ng/mg). Data are presented as mean ± SD, n = 3, **P < 0.01 vs. CON.
Figure 8. Autophagy is decreased in the GCs of bPOI patients, and a model for autophagic regulation in ovarian GCs differentiation is proposed. (A) Immunofluorescence staining showed that almost all of the cells were CYP19A1-positive (red). The nuclei were stained with DAPI (blue). Scale bar: 150 μm. (B) The expression of LC3 and SQSTM1 proteins in GCs from controls and bPOI patients was detected by Western blot, and representative results are shown. GAPDH was used as the loading control. Quantitative analysis showed a lower LC3-II:LC3-1 ratio (C) and higher level of SQSTM1 (D) in the GCs of bPOI patients (n = 13), compared to controls (n = 15). Data are presented as mean ± SD. ***P < 0.001 vs. Control. (E) A proposed model for the role of autophagy in ovarian GC differentiation. In the normal situation (left), autophagy facilitates the maintenance of the WT1 protein, which is an inhibitory transcriptional factor for the differentiation of GCs. This precisely regulated expression pattern of WT1 is crucial for the differentiation of GCs and promotes the expression of the key genes in GC differentiation, such as CYP19A1 and FSHR, and the E2 synthesis ability is enhanced resulting from the maturation of GCs. However, when autophagy insufficiency occurs in GCs (right), the accumulated WT1 caused by delayed degradation inhibits the expression of genes involved in GC differentiation and thus leads to insufficient E2 production.
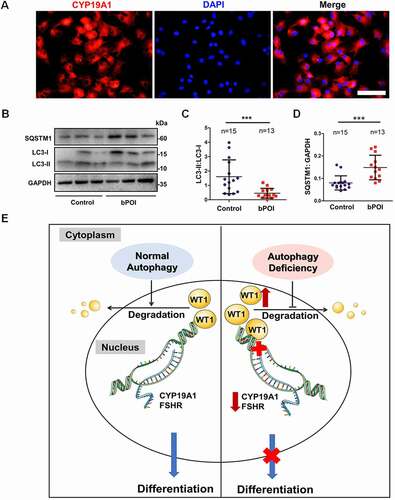
Table 1. Antibody information.