
Figures & data
Figure 1. ATG12 expression is lost in a subpopulation of HNSCC. (A) Analysis by conventional PCR displays lack of ATG12 mRNA transcripts in 7 of 17 patients, whereas LC3B is efficiently amplified. (B) Quantitative real-time PCR confirms decreased ATG12 mRNA abundance in 5 of 17 patients. The hypoxia-regulated proteins ATG5, LC3B and VEGF do not follow a similar pattern. (C) Within the HPV-negative TCGA HNSCC cohort 176 patients display a single, or homozygous deletion of the ATG12 gene. (D) Loss in copy number is associated with decreased ATG12 mRNA presence in the HPV-negative HNSCC TCGA cohort. The range of expression values of patients with homozygous deletions was considered ATG12-negative. (E) Representative immunohistochemical staining of an ATG12-positive (left) and ATG12-negative (right) HNSCC tumor biopsy. ATG12 (Red) and hypoxia (pimonidazole, green). (F) Tumors that lack ATG12 protein expression (ATG12low n = 14) display decreased tumor hypoxia compared to ATG12-proficient tumors (ATG12high n = 37). (G) ATG12low and ATG12high tumors display comparable vessel densities (ATG12low n = 13; ATG12high n = 21). (H) relative vessel areas (vessel size) (ATG12low n = 12; ATG12high n = 22) and (I) comparable vessel perfusion (BrdUrd+ in 25-μm radius. ATG12low n = 7; ATG12high n = 16). (J) Real-time quantitative PCR analysis of ATG12 mRNA expression in 9 cancer cell lines exposed to severe hypoxia (0.02% O2) (mean + SEM, n = 3).
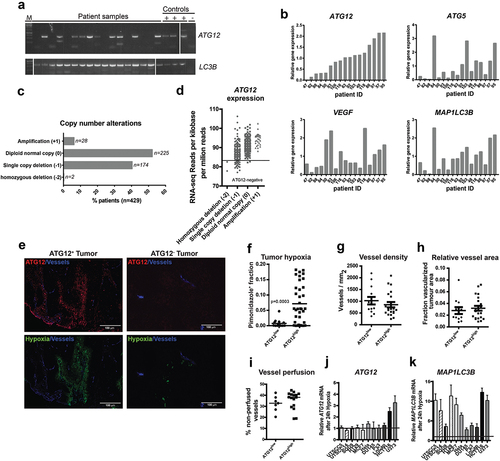
Figure 2. ATG12-deficiency is associated with improved prognosis in late stage HNSCC patients.
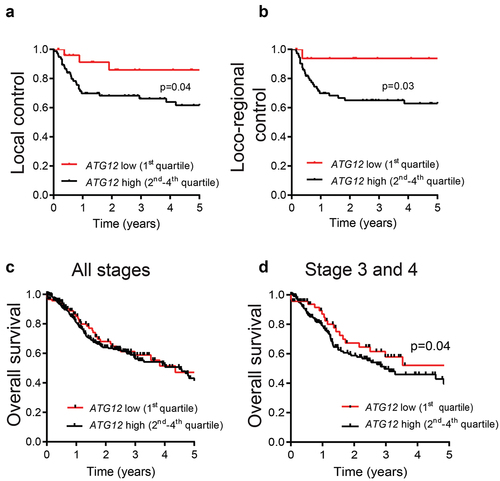
Figure 3. ATG12 expression is associated with prognosis in multiple cancer types. Overall survival of the GDC ATCC (A) ovarian cancer, (B) infiltrating ductal breast cancer, (C) pancreatic cancer, (D) renal clear cell carcinoma, (E) renal papillary cell carcinoma and (F) kidney chromophobe. Patient populations were split on median ATG12 expression. (G) Hazard ratios of the HNSCC cohorts (.) and patient populations of Figure 3
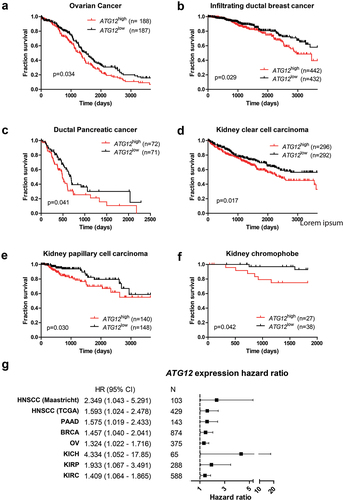
Figure 4. Loss of ATG12 expression contributes to improved tumor control. (A) immunoblot of UTSCC5 cells expressing a doxycycline inducible control shRNA or 2 independent shRNA that target ATG12. Chloroquine (CQ) is used to measure LC3B-II turnover as autophagy activity. (B) Growth curves of UTSCC5 control (n = 5, open circles) and inducible shATG12 #1 (n = 8, filled squares) xenografts. (C) Kaplan-meier curve of tumors reaching 500 mm3. (D) Vessel density was determined by 9F1 immunohistochemistry (error bars ±SEM). (E) Perfused vessel density of UTSCC5 xenografts is decreased in ATG12 knockdown xenografts (error bars ±SEM, p = 0.003). (F) Hypoxic fraction was determined using pimonidazole immunohistochemistry (error bars ±SEM). (G) Tumor necrosis of UTSCC5 xenografts was examined morphologically by H&E staining (error bars ±SEM, p = 0.04). (H) Established tumors were irradiated (10 Gy) when reached 150 mm3. Doxycycline (5 g/L) was administered via the drinking water 7 days prior to the treatment to induce expressing of the hairpin. In ATG12 knockdown xenografts (open circles, n = 10, error bars ±SEM) tumor regrowth is delayed compared to controls (filled squares, n = 10, error bars ±SEM). (I) Kaplan-meier curve xenografts of tumors reaching 4 x the irradiated volume). (J) human ATG12 mRNA abundance determined in shSCR (n = 10) and shATG12 (n = 3) tumors that regrew after irradiation. As a reference, knockdown in non-irradiated and size-matched shATG12 tumors (n = 6) is shown (right column).
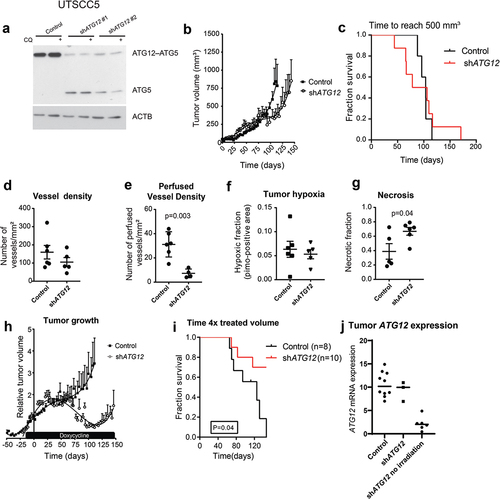
Figure 5. ATG12 is required for glutamine homeostasis and mediates survival during hypoxia in MEFs and UTSCC5 cells. (A) Clonogenic survival of control, ATG12−/− and ATG12−/− where ATG12 is re-expressed (rescue) MEF (left panels) or UTSCC5 cells that express control or ATG12-targeting shRNA (right panels) after exposure to moderate (O2 = 0.2%) or severe (O2 < 0.02%) hypoxia in complete medium (mean ± SEM, n = 3). (B) Clonogenic survival of MEF (left panels) and UTSCC5 cells after exposure to moderate and severe hypoxia in glucose-depleted medium (mean ± SEM, n = 4). (C) Glucose use by MEF and UTSCC5 cells over 24 h in complete medium (left panels) and in L-glutamine depleted medium (right panels) under ambient oxygen, moderate and severe hypoxia (mean ± SEM, n = 4). (D) Extracellular (left panels) and intracellular (right panels) after 24 h incubation under ambient oxygen, moderate or severe hypoxia (mean ± SEM, n = 4). (E) basal glycolysis as determined ECAR (Seahorse) of MEF (left panel) and UTSCC5 cells (right panel) in the absence or presence of 2 mM L-glutamine (mean ± SEM, n = 4). (F) Clonogenic survival of MEF and UTSCC5 cells after exposure to moderate or severe hypoxia in the absence of glucose and L-glutamine in culture medium during exposure (mean ± SEM, n = 4) * indicates p < 0.05.
Figure 6. ATG12 deficiency results in disruption of glutamine homeostasis in UTSCC14 and SQD9 cells. (A) immunoblot of UTSCC14 and SQD9 cells expressing a doxycycline inducible control shRNA or ATG12-targeting shRNA. Clonogenic survival of SCR (n = 6) shRNA #1 (n = 3) or shATG12 #2 (n = 3) expressing UTSCC14 (left panels) or SQD9 (right panels) after exposure to moderate (O2 = 0.2%) or severe (O2 < 0.02%) hypoxia in (B) complete or (C) glucose deprived culture medium (mean ± SEM). (D) Glucose use over 24 h in complete medium (left panels) and in L-glutamine depleted medium (right panels) under ambient oxygen, moderate and severe hypoxia (mean ± SD). (E) Extracellular (left panels) and intracellular (right panels) L-glutamine of SCR (n = 7), shATG12 #1(n = 3) and shATG12 #2 (n = 4) cells after 24 h incubation under ambient oxygen, moderate or severe hypoxia (mean ± SD). Clonogenic survival of shSCR (n = 6) shATG12 #1 (n = 3) or shATG12 #2 (n = 3) expressing UTSCC14 (left panels) or SQD9 (right panels) after exposure to moderate (O2 = 0.2%) or severe (O2 < 0.02%) hypoxia in (F) L-glutamine- deprived or (G) glucose- and L-glutamine-deprived culture medium. * indicates p < 0.05.
Figure 7. Supplementing ATG12-deficient cells with L-glutamine restores cellular survival during hypoxia. Clonogenic survival of control or ATG12-deficient UTSCC5 (left), UTSCC14 (middle) and SQD9 (right) cells after exposure to moderate (A) or severe (B) hypoxia in the absence of glucose and supplemented with 0, 1, 2, 4 or 8 mM L-glutamine (mean ± SEM, n = 3). * indicates p < 0.05.
Figure 8. Model for ATG12 dependence during hypoxia. During normal oxygenation and sufficient glucose abundance, glucose is used as the preferred carbon source. Areas that receive insufficient oxygen are also hampered in glucose delivery and are therefore more reliant on glutamine metabolism as carbon source. ATG12 proficient cells are capable of maintaining high intracellular glutamine levels and maintain a viable radiotherapy-resistant hypoxic fraction. ATG12-deficient cells cannot maintain high intracellular glutamine during hypoxia, resulting in hypoxic cell death, decreased tumor hypoxia and improved prognosis after therapy.
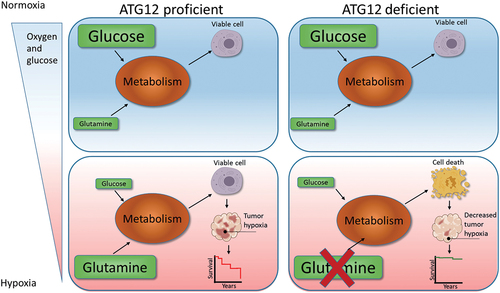
Table 1. Primers used for qPCR determination.