Figures & data
Figure 1. SVA-induced autophagy inhibits viral replication by degrading the SVA 3 C protein in the early stage of viral infection. (A) PK-15 cells were mock-infected or infected with SVA at an MOI (multiplicity of infection) of 1 and harvested at 0, 3, and 6 hpi. The expression of SVA 3D and LC3 proteins were analyzed by Western blotting. ACTB/β-Actin was used as the sample loading control. (B, C, and D) PK-15 cells were incubated or mock incubated with Rapa for 4 h and then infected with SVA for the indicated times. The cells lysates and culture supernatants were collected to analyze SVA 3D expression and viral titers with Western blotting, real-time PCR, and TCID50 assay. (E, F, and G) PK-15 cells were incubated with CQ and then infected with SVA. The cells lysates and culture supernatants were collected to analyze SVA 3D expression and viral titers with Western blotting, real-time PCR, and TCID50 assay. (H) 293 T cells were transfected with empty vectors or plasmids encoding Flag-tagged 2AB, 2 C, 3AB, 3 C, and 3D proteins for 12 h and then treated with Rapa (6.25 μM) for 12 h. The cell lysates were analyzed by Western blotting. (I) 293 T cells were transfected with the vector expressing Flag-3 C and treated with increasing concentrations of Rapa (wedge) for 12 h. The protein level of 3 C was analyzed with Western blotting. Data are means ± SD of triplicate samples. *P < 0.05, **P < 0.01, ***P < 0.001 (two-tailed Student’s t-test).
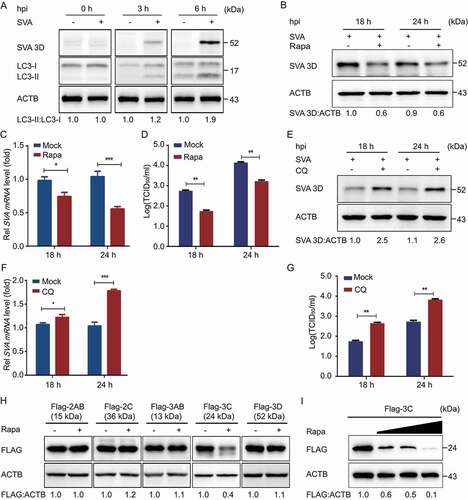
Figure 2. Autophagy is inhibited by SVA 2AB protein in the late stage of viral infection. (A) PK-15 cells were mock-infected or infected with SVA at an MOI (multiplicity of infection) of 1 and harvested at the indicated times. The expression of SVA 3D and LC3 proteins were analyzed by Western blotting. ACTB was used as the sample loading control. (B) 293 T cells were transfected with empty vectors or plasmids encoding Flag-tagged viral proteins for 24 h. The cell lysates were analyzed by Western blotting. (C) 293 T cells were transfected with the increasing concentrations of a vector expressing Flag-2AB for 24 h, and the protein was harvested for Western blotting. (D) 293 T cells were transfected with plasmids encoding Flag-2AB. Twenty-four hours later, the cells were treated with Baf A1 (0.1 μM), CQ (10 μM), Rapa (6.25 μM), or MG132 (5 μM). The cell lysates were then analyzed by Western blotting. Data are means ± SD of triplicate samples. *P < 0.05, **P < 0.01, ***P < 0.001 (two-tailed Student’s t-test).
Figure 3. SVA 2AB promotes LC3 protein degradation through MARCHF8 to ubiquitinate LC3. (A) 293 T cells were transfected with plasmids encoding Flag-2AB or empty vectors for 24 h, followed by Co-IP with anti-Flag binding beads and immunoblot analysis with indicated antibodies. ACTB was used as the sample loading control. (B) The GST-MARCHF8 and Flag-2AB proteins were expressed in bacterial strain BL21 (DE3) and purified for the GST affinity-isolation analysis. (C) HeLa cells were transfected with plasmids encoding MYC-MARCHF8 and Flag-2AB, followed by labeling MYC-MARCHF8 and Flag-2AB with a specific primary antibody. The cell nuclei were stained with DAPI. Fluorescent signals were observed using confocal immunofluorescence microscopy. Scale bars: 100 μm. (D) Co-IP assay of cells transfected with plasmids encoding Flag-2AB or empty vector. (E) Immunofluorescence assay of cells transfected with plasmids encoding Flag-2AB and GFP-LC3. (F) Co-IP assay of cells transfected with plasmids encoding Flag-MARCHF8 or empty vector. (G) Immunofluorescence assays of cells transfected with plasmids encoding MYC-MARCHF8 and GFP-LC3. (H) 293 T cells were transfected with plasmids encoding Flag-2AB and MYC-MARCHF8 or empty vectors for 24 h. The protein was harvested for immunoblot analysis. (I) 293 T cells were transfected with plasmids encoding Flag-2AB and MARCHF8 siRNA or negative control (NC) siRNA for 24 h. The protein was harvested for immunoblot analysis. (J) 293 T cells were co-transfected with GFP-LC3 plasmid and Flag-2AB or MYC-MARCHF8 plasmid. Cell lysates were harvested after CQ (10 μM) treatment for 8 h. Proteins extracts were immunoprecipitated using an anti-GFP antibody and analyzed by Western blotting using anti-ubiquitin (Ub) and anti-GFP antibodies.
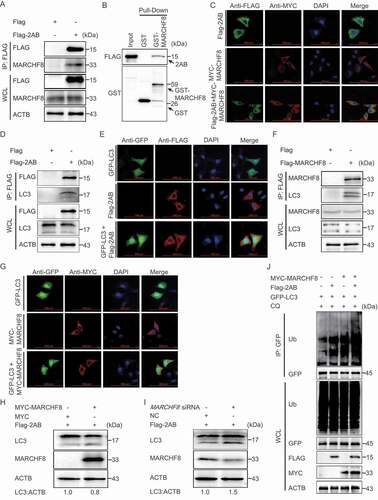
Figure 4. SVA 2AB promotes the autophagic degradation of MAVS through combining with MARCHF8. (A and B) 293 T cells were transfected with the IFNB or ISRE luciferase reporter, together with the increasing amounts (wedge) of the expression vector for Flag-2AB. (C) 293 T cells were transfected with the increasing concentrations of plasmids encoding Flag-2AB for 24 h. The cell lysates were analyzed with Western blotting. ACTB was used as the sample loading control. (D) 293 T cells were transfected with plasmids encoding Flag-2AB. Twenty-four hours later, the cells were treated with Baf A1 (0.1 μM), CQ (10 μM), Rapa (6.25 μM), or MG132 (5 μM). The cell lysates were then analyzed by Western blotting. (E) 293 T cells were transfected with plasmids encoding MYC-MAVS and Flag-2AB or empty vectors for 24 h, followed by Co-IP with anti-Flag binding beads and immunoblot analysis with indicated antibodies. (F) HeLa cells were transfected with plasmids encoding MYC-MAVS and Flag-2AB, then labeling MYC-MAVS and Flag-2AB with a specific primary antibody. The cell nuclei were stained with DAPI. Fluorescent signals were observed using confocal immunofluorescence microscopy. Scale bars: 100 μm. (G) The GST-MAVS and Flag-2AB proteins were expressed in bacterial strain BL21 (DE3) and purified for the GST affinity-isolation analysis. (H) 293 T cells were transfected with plasmids encoding Flag-2AB and MYC-MARCHF8 or empty vectors for 24 h. The protein was harvested for immunoblot analysis. (I) 293 T cells were transfected with plasmids encoding Flag-2AB and MARCHF8 siRNA or negative control (NC) siRNA for 24 h. The protein was harvested for immunoblot analysis. Data are means ± SD of triplicate samples. *P < 0.05, **P < 0.01, ***P < 0.001 (two-tailed Student’s t-test).
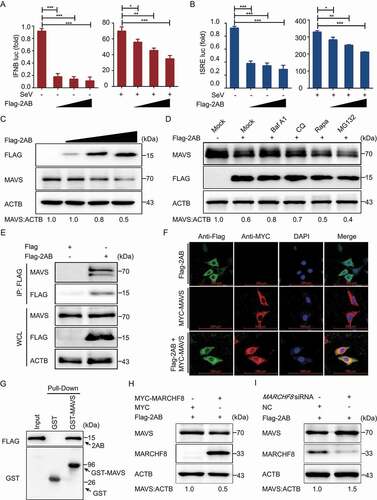
Figure 5. SVA 2AB promotes MARCHF8 degradation suppressing the activation of IFN-I signaling. (A) 293 T cells were transfected with the increasing concentrations of plasmids encoding Flag-2AB for 24 h. The cell lysates were analyzed with Western blotting. ACTB was used as the sample loading control. (B) 293 T cells were transfected with plasmids encoding Flag-2AB and MYC-MARCHF8. Twenty-four hours later, the cells were treated with Baf A1 (0.1 μM), CQ (10 μM), Rapa (6.25 μM), or MG132 (5 μM). The cell lysates were then analyzed by Western blotting. (C) Lysates of 293 T cells transfected with the IFNB (up) or ISRE (down) luciferase reporter, together with the plasmid encoding MARCHF8 and empty vector, followed by SeV infection, were used for luciferase assay. (D) Lysates of 293 T cells transfected with the IFNB (up) or ISRE (down) luciferase reporter, together with the MARCHF8 siRNA or NC siRNA, followed by SeV infection, were used for luciferase assay. (E and F) PK-15 cells were mock-infected or infected with SVA at an MOI (multiplicity of infection) of 1 and harvested at indicated times. The protein and transcription level of MARCHF8 were analyzed by Western blotting and real-time PCR assays. (G) PK-15 cells were transfected with the vector expressing MARCHF8 or vector control, infected with SVA (MOI = 1). SVA 3D protein was analyzed with Western blotting. (H) The viral RNA levels in the culture supernatants of PK-15 cells treated as described in (G) were determined using real-time PCR. (I and J) PK-15 cells were transfected with MARCHF8 siRNA or negative control siRNA for 24 h. The cells were infected with SVA. Viral protein abundance and viral RNA levels were measured using Western blotting and real-time PCR. (K) Luciferase activity in 293 T cells transfected with IFNB promoter-driven luciferase reporters and together with plasmid encoding Flag-2AB and MYC-MARCHF8 or empty vector. (L) Luciferase activity in 293 T cells transfected with IFNB promoter-driven luciferase reporters and together with plasmid encoding Flag-2AB and MARCHF8 siRNA or negative control siRNA. Data are means ± SD of triplicate samples. *P < 0.05, **P < 0.01, ***P < 0.001 (two-tailed Student’s t-test).
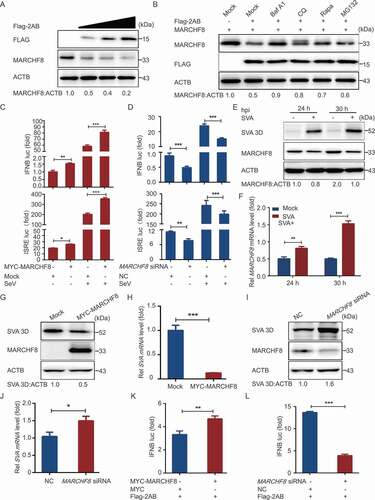
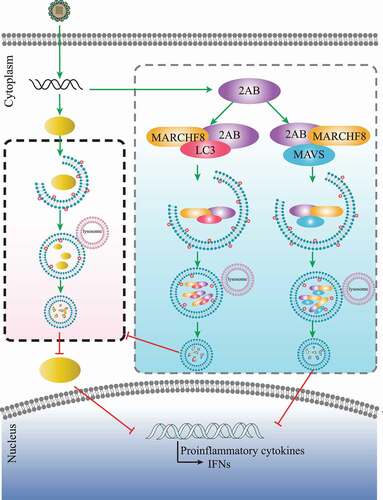
Figure 6. A proposed working model to illustrate autophagy inhibited SVA replication by degrading virus 3C protein, and 2AB protein degrading LC3, MARCHF8 and MAVS antagonize selective autophagy and type I interferon production in SVA infection.