Figures & data
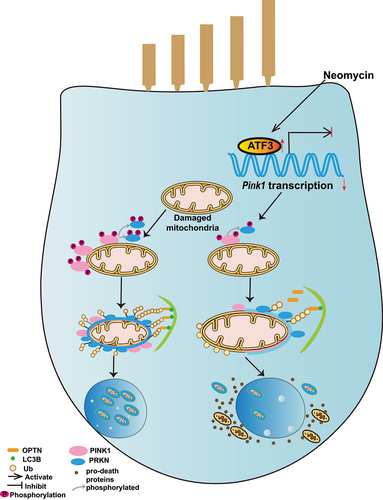
Figure 1. PINK1-PRKN-mediated mitophagy is inhibited after neomycin treatment. (A) Immunofluorescence staining with TOMM20 antibody showed that neomycin treatment repressed mitochondria (green) clearance induced by CCCP in mCherry-PRKN-expressing HEI-OC1 cells. Cells were treated with neomycin (0.5 mM) and CCCP (20 μM) for 24 h. (B) Quantification of the cells without mitochondria in A, n = 3. (C) Western blot showing changes in mitochondrial proteins (HSPD1 and TOMM20) in HEI-OC1 cells. Cells were treated with neomycin (0.5 mM) and CCCP (20 µM) for 24 h, and GAPDH was used as the control protein. (D) Immunofluorescence staining with TOMM20 showed that neomycin treatment inhibited PRKN (red) accumulation on mitochondria (gray) induced by CCCP in mCherry-PRKN-expressing HEI-OC1 cells. Cells were treated with neomycin (0.5 mM) and CCCP (20 μM) for 6 h. (E) Quantification of the western blot results in C, n = 3. (F) Quantification of the cells with mCherry-PRKN accumulation on mitochondria in D, scored for ≥100 cells per condition, n = 5. For all experiments, ** p < 0.01 and **** p < 0.0001. Data are shown as means ± S.D.
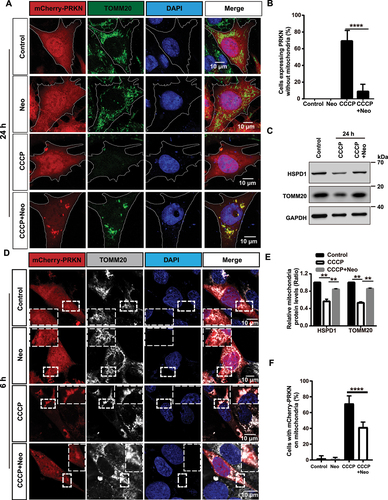
Figure 2. The recognition of damaged mitochondria by the autophagosome is impaired after neomycin exposure. (A) Immunofluorescence with TOMM20 and HA antibody showing changes in the colocalization of ubiquitin (red) and TOMM20 (gray) after co-treatment with 20 µM CCCP and 0.5 mM neomycin for 6 h. HEI-OC1 cells were transfected with EGFP-PRKN and HA-ubiquitin. (B) Quantification of the percentage of EGFP-PRKN-positive HEI-OC1 cells with ubiquitin on the mitochondria in A, n = 4. (C) The colocalization of EGFP-OPTN and TOMM20 (gray) after the FLAG-PRKN-expressing HEI-OC1 cells were co-treated with 20 μM CCCP and 0.5 mM neomycin for 6 h. (D) Quantification of the number of EGFP-OPTN puncta on the mitochondria in FLAG-PRKN-expressing HEI-OC1 cells. At least 20 cells were counted in each experiment. (E) Immunofluorescence using FLAG-PRKN-expressing HEI-OC1 cells showing changes in the colocalization of EGFP-OPTN and mCherry-LC3B after the cells were co-treated with 20 μM CCCP and 0.5 mM neomycin for 6 h. (F) Quantification of the number of mCherry-LC3B puncta co-localized with OPTN in E, n = 3. For all experiments, ***p < 0.001 and ****p < 0.0001. Data are shown as means ± S.D.
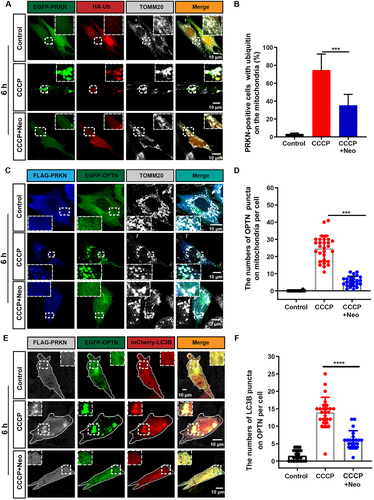
Figure 3. Mitophagic flux is impaired after neomycin treatment. (A) Representative confocal image of mt-mKeima showing that the number of mitochondria-containing lysosomes was reduced in EGFP-PRKN-expressing HEI-OC1 cells after neomycin treatment for 6 h. (B) Similar experiments as in A were performed, but the HEI-OC1 cells were treated with neomycin for 20 h. (C-D) Quantification of the intensity of the red mt-mKeima fluorescence, which reflected mitophagic flux. At least 36 cells per experiment were counted. n = 3. For all experiments, ** p < 0.01 and **** p < 0.0001. Data are shown as means ± S.D.
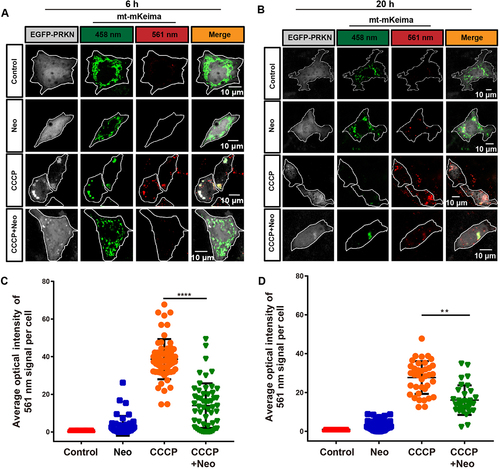
Figure 4. Neomycin treatment reduces PINK1 expression in HEI-OC1 cells. (A) Western blot showing changes of PINK1 protein level and phosphorylated PINK1 in HEI-OC1 cells after treatment with 0.5 mM neomycin for 6 h. The cells were also treated with 20 µM CCCP for 6 h. Immunoblot with anti-PINK1 and anti-p-PINK1 Ser228. (B) Quantification of PINK1 protein level in A, n = 3. (C) Quantification of phosphorylated PINK1 (Ser228) relative to total PINK1 levels in A, n = 3. (D) HEI-OC1 cells expressing exogenous PINK1-FLAG were treated with neomycin (0.5 mM) and/or CCCP for 6 h, then Tris-glycine SDS-PAGE with or without 25 μM phos-tag was performed to detect phosphorylated PINK1. Immunoblot with anti-FLAG antibody. Red asterisks indicate the phosphorylated band of PINK1, FL: full length. (E) Western blot showing the level of phospho-ubiquitin (Ser65) in HEI-OC1 cells treated with 20 μM CCCP and 0.5 mM neomycin for 6 h. Cells were transfected with mCherry-C1 (as the negative control) and mCherry-PRKN. (F) RT-qPCR analysis of Pink1 transcription in HEI-OC1 cells treated with neomycin (0.2 mM, 0.5 mM, 1 mM, 2 mM, and 5 mM) for 6 h, n = 4. (G) Western blot showing the degradation of PINK1 in HEK 293 cells, which were treated with 20 μM CCCP and 0.5 mM neomycin for 3 h followed by CCCP washout (W/O) at the indicated times. PINK1 protein was detected at the indicated times after CCCP washout. (H) RT-qPCR analysis of Pink1 transcription in HEI-OC1 cells treated with 0.5 mM neomycin (6 h, 12 h, and 24 h), n = 4. For all experiments, *p < 0.05, ** p < 0.01, and ***p < 0.001. Data are shown as means ± S.D.
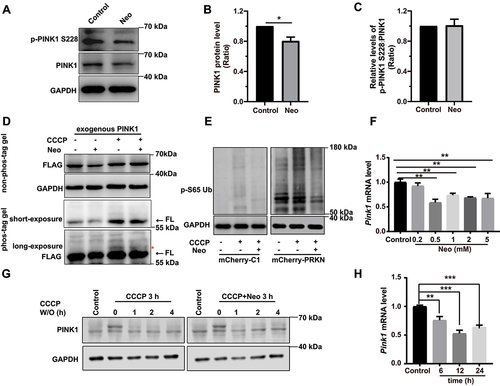
Figure 5. Neomycin activates ATF3 protein expression to repress Pink1 transcription. (A) Western blot results showing the protein levels of three transcription factors (ATF3, XBP1, and FOXO3) in HEI-OC1 cells after CCCP (20 μM) treatment for 6 h, with or without neomycin (0.5 mM). (B) Analysis of the protein levels of ATF3, XBP1, and FOXO3 in A, n = 3. (C) Atf3 mRNA level in HEI-OC1 cells treated with neomycin for 6 h and 24 h. Atf3 mRNA gradually increased over time. (D) HEI-OC1 cells were transfected with Atf3 siRNA for 24 h and then treated with CCCP (20 μM) for 6 h, and western blot results showing protein levels of ATF3 and PINK1. After knockdown of Atf3, PINK1 levels were increased. (E) Quantification of the western blot results in D, n = 3. (F) Pink1 promoter activity after HEI-OC1 cells treated with neomycin (0.5 mM) for 24 h. Cells were transfected with a Pink1 luciferase promoter reporter plasmid and Renilla reniformis luciferase plasmid. n = 3. (G) Schematic diagram of the Pink1 promoter luciferase reporter plasmid. The arrow indicates the direction of Pink1 transcription. (H) The Pink1 promoter activity assay after knockdown of Atf3 in which HEI-OC1 cells were transfected with plasmids as described in F, n = 3. (I) Analysis of promoter activity after HEI-OC1 cells were exposed to neomycin (0.5 mM) in the absence or presence of Atf3 siRNA, the control siRNA and undamaged groups were normalized as 100%, n = 4. For all experiments, *p < 0.05, **p < 0.01, and ***p < 0.001. Data are shown as means ± S.D.
Figure 6. Promoting mitophagy prevents HC death after neomycin treatment in vitro. (A) Confocal image of ATOH1-EGFP mouse cochleae expressing Anc80L65-CAG-mt-mkeima-mNeonGreen-P2A (AAV). The signal of mitophagic flux indicated by mt-mKeima (red) was excited by a 561 nm laser. Note that the EGFP signal that was used to mark HCs (green) was excited by a 488 nm laser. Cochlear explants (middle turn) were treated with 0.5 mM neomycin and 20 μM CCCP for 24 h and observed immediately. White arrows indicate damaged mitochondria in a lysosomal acidic environment. (B) Schematic of the explant culture with neomycin and DFP treatment experiments. (C) Immunofluorescence with MYO7A showing the HC loss after neomycin exposure. The explants were pre-treated with 0.25 mM DFP for 48 h. MYO7A (red) antibody was used to mark HCs. (D-E) Immunofluorescence showing TUNEL (green) and MYO7A (red) double-positive cells in the middle and basal turns of the cochlea. Explants were pretreated with 0.25 mM DFP for 48 h, followed by 0.5 mM neomycin treatment for 20 h. Scale bar: 20 μm. (F-G) Quantification of HCs (MYO7A-positive cells) in the middle and basal turns of the cochlea in C, n = 3. (H-I) Quantification of TUNEL and MYO7A double-positive cells in the middle and basal turns of the cochlear explants in D and E, n = 3. (J-K) Immunofluorescence staining showing TUNEL (green) and MYO7A (red) double-positive cells in the middle and basal turns of the cochlea after different treatments as indicated for 20 h. Scale bar: 20 μm. (L-M) Quantification of MYO7A-positive HCs in the middle and basal turns after treatment with Usp30 siRNAs and neomycin, n = 3. (N-O) Quantification of TUNEL and MYO7A double-positive HCs in the middle and basal turns of the cochlea in J and K, n = 3. For all experiments, * p < 0.05, **p < 0.01, ***p < 0.001, and ****p < 0.0001. Data are shown as means ± S.D.
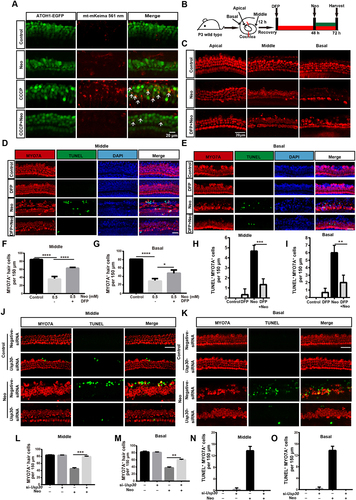
Figure 7. Kinetin prevents neomycin-induced hearing loss in vivo. (A) Schematic of the animals treated with neomycin and kinetin. (B) ABR threshold analysis after mice were exposed to 30 mg/kg or 60 mg/kg kinetin for 7 days, n = 3. (C) ABR thresholds after 100 mg/kg neomycin exposure with different concentrations of furosemide (100 mg/kg, 200 mg/kg, and 300 mg/kg), n = 3. (D) Representative immunofluorescence of MYO7A images showing hair cells from the apical, middle, and basal turns of the cochlea. Eight-week-old mice were administrated with the following as indicated, control: saline, neo: 100 mg/kg neomycin, Furo: 200 mg/kg furosemide, and Kinetin: 30 mg/kg kinetin. (E) ABR thresholds after exposure to neomycin and furosemide with or without kinetin treatment. neo: 100 mg/kg neomycin, Furo: 200 mg/kg furosemide, and Kinetin: 30 mg /kg kinetin. n = 6. (F) Residual outer hair cell (OHC) numbers per 100 μm from mice with different treatments in D, n = 6. For all experiments, * p < 0.05, **p < 0.01, and ***p < 0.001. Data are shown as means ± S.D.
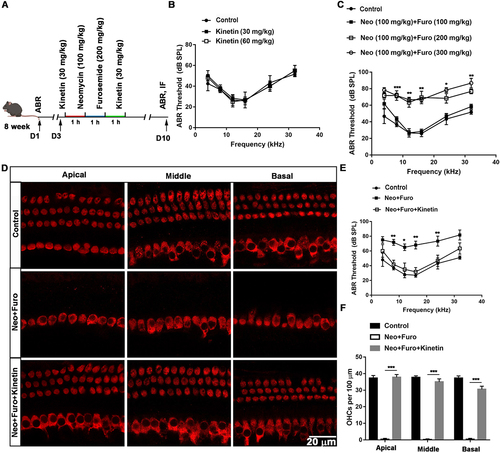
Figure 8. Kinetin prevents neomycin-induced ribbon synapse damage in vivo. (A) Representative images of CTBP2-labeled pre-synapses and GRIA2-labeled post-synapses in cochlear apical, middle, and basal turns in C57BL/6 mice after exposure to neomycin for 7 days. Significant differences are evident between the control (saline), neomycin, and kinetin exposure groups. neo: 100 mg/kg neomycin, Furo: 200 mg/kg furosemide, Kinetin: 30 mg/kg kinetin. Scale bar: 10 µm. (B) Quantification of the CTBP2 puncta in A, n = 3. (C) Quantification of the GRIA2 puncta in A, n = 3. (D) The quantification of orphan ribbons after neomycin and kinetin treatment. All groups contained 4 mice. For all experiments, *p < 0.05, ** p < 0.01, and ***p < 0.001. Data are shown as means ± S.D.
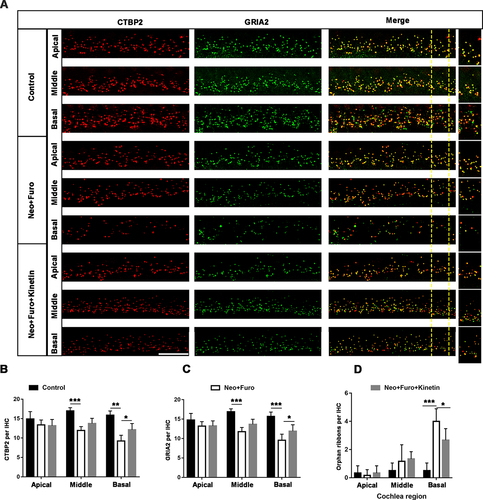
Figure 9. Schematic representation of how neomycin attenuates PINK1-PRKN-mediated mitophagy by promoting ATF3 expression.