Figures & data
Figure 1. LCN2 binds to and regulates ATG4B-mediated LC3 processing. (a) Floxed RPE explants infected with adenovirus-GFP (Ad-GFP) or adenovirus-LCN2-GFP (Ad-LCN2-GFP) constructs were lysed followed by co-immunoprecipitation using GFP-trap magnetic beads and western blotting for ATG4B, showed binding between LCN2 and ATG4B. n = 4. (b) Immunofluorescence studies and Pearson’s coefficient analysis on individual ARPE19 cells infected with Ad-LCN2-GFP and then stained with ATG4B antibody (red) showed colocalization between the two proteins (yellow fluorescence; arrows), in the merged image, compared to Rabbit IgG (ATG4B antibody isotype) stained cells. Scale bar: 10 μm. n = 15. (c) Thermal shift assay showing an increase in the melting temperature (Tm) of recombinant human ATG4B, when it was incubated at a dose of 0.5 μg/ml with 1 μg/ml human LCN2 protein (gray line), compared to only ATG4B protein (Orange line), indicating a binding affinity between the two proteins. The melting temperature is reflective of the change in sypro orange fluorescence (arbitrary unit) which was added (5 μM) to each reaction mixture. n = 4. (d) Molecular modeling showing possible complex formation involving ATG4B, LCN2 and LC3 proteins. LCN2 (Orange) could interact with the catalytic site of ATG4B (purple), including residues cysteine 74 (Cys74; yellow), aspartate 278 (Asp278; red), and histidine 280 (His280; red), where LC3 (green) binds and is cleaved by ATG4B. (e) Western blot showing cleavage of GST in a cell-free Atg4B activity assay in vitro using recombinant human LC3-GST protein (20 μg/ml) incubated with recombinant human ATG4B (0.5 μg/ml), in the presence or absence of human recombinant LCN2 (1.0 μg/ml) for 15 min at room temperature. Cleavage of GST was inhibited upon LCN2 addition. The blot was over-exposed to allow evaluation of the levels of cleaved GST in the different conditions. n = 4. (f) ATG4B-mediated lipidation (LC3 processing) activity was assessed by transfecting ARPE19 cells with a GFP-LC3-RFP-LC3∆G construct and treating with recombinant LCN2 (1.0 μg/ml) for 24 h as a positive control or infecting with an Ad-LCN2 construct for 48 h, followed by flow cytometry. An increased GFP:RFP ratio, which indicates decreased lipidation, was evident in recombinant LCN2 treated and Ad-LCN2 infected cells, relative to untreated controls. n = 4. All values are Mean ± SD, while the results from the flow cytometry experiment are represented as Median ± SD. Significant changes are indicated by *P < 0.05, **P < 0.01, ***P < 0.001.
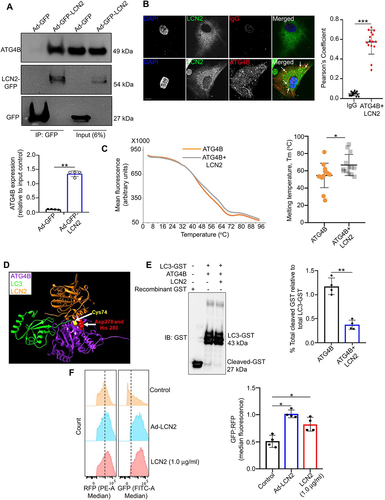
Figure 2. LCN2 triggers alterations in autophagy. (a) Electron microscopy images of RPE cells showing abnormal accumulation of undigested outer segments (arrow in Aii) and double membrane autophagosomes in aged (20 months old) cryba1 cKO mice (arrows in Aiii- iv), relative to age-matched floxed controls (Ai). Scale bar: 500 nm. n = 6. (b) Dot representation of scRNAseq analysis from the sub-retinal region of 15-month-old cryba1 cKO mice showing differential expression of several autophagy genes. In particular, genes which are required for autophagosome processing like AMBRA1, ATG4C, ATG9B, ATG7 and LC3A and B are downregulated in the RPE cell cluster, compared to age-matched floxed controls n = 4. (c) qPCR analysis showing decreased gene expression of Atg7, Atg9 and LC3b in 10-month-old cryba1 cKO mice, compared to controls. n = 4. (d) Western blot analysis for LC3-I and LC3-II in floxed RPE explants treated with an Ad-LCN2 construct (107 vg/ml for 48 h) showed decreased autophagy flux (indicated by increased LC3-II) in chloroquine (ChQ) treated cells, compared to untreated controls. n = 4. (e) ARPE19 cells infected with an Ad-LCN2 construct or left untreated (control) for 48 h, followed by an overnight infection with an Adenovirus-GFP-RFP-LC3B construct to label the autophagosomes (yellow) and autolysosomes (red). The number of autolysosomes (red puncta) was significantly decreased in Ad-LCN2 infected cells (arrows showing decrease in the number of red puncta) when compared to controls, further suggesting decline in autophagy flux in RPE cells overexpressing LCN2. “X” indicates mean of the box plot. Scale bar: 20 μm. All values are Mean ± SD. Significant change between control and Ad-LCN2 infected cells is indicated by *P < 0.05 and **P < 0.01.
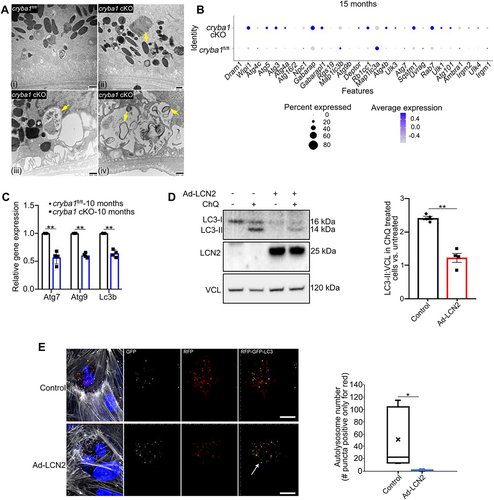
Figure 3. Iron deregulation in RPE cells potentiates inflammasome activation via the CGAS-STING1 pathway. (a) Intracellular redox sensitive (ferrous, Fe+2) iron levels in RPE cells from young (4-months old) and aged (10-months old) cryba1 cKO mice showed increase in both fed and starved (16 h) conditions compared to age-matched floxed controls. n = 4. (b) RPE explants from WT and cryba1 KO mice were cultured in the presence of iron-rich medium containing 250 μM ferric ammonium citrate (FAC) for 72 h and infected with an Ad-LCN2 (107 vg/ml, 48 h) construct to simulate an iron rich and high LCN2 environment as is prevalent in vivo. Assessment of iron levels in these cells revealed an increase in iron levels in cryba1 KO RPE cells treated with FAC or infected with the LCN2 construct, compared to WT cells subjected to the same treatments, indicating that appropriate lysosomal function is essential for maintaining iron homeostasis in RPE cells. n = 4. (c) Western blot analysis and densitometry showing increased levels of NLRP3, CGAS and STING1 in the RPE cells of aged (10 months old) cryba1 cKO mice when compared to age-matched controls. n = 4. (d) ELISA levels of IL1B were increased in the RPE cells of 10-month-old cryba1 cKO in comparison with age-matched floxed cells. n = 4. (e) RPE explants from WT and cryba1 KO mice, along with sting1 KO and Sting1GT mutant mice, which are animal models with global knockout of STING1, were cultured in presence of FAC, Ad-LCN2, or both with and without ChQ. Western blot analysis and densitometry showed increase in NLRP3, CGAS and STING1 expression in the cryba1 KO RPE cells treated with FAC and Ad-LCN2; similar treatment along with ChQ addition to block lysosomal function in sting1 KO or Sting1GT mutant RPE cells did not show an increase in these proteins. n = 4. (f) ELISA analysis showing elevated levels of IL1B in cryba1 KO RPE explants treated with FAC and Ad-LCN2, while there was a decrease in the level of the cytokine in sting1 KO and Sting1GT mutant RPE explants cultured in presence of FAC, Ad-LCN2 and ChQ. n = 4. (g) Western blot analysis showing that treatment with deferoxamine (Def; 100 μM for 24 h), a known iron chelator, rescued the levels of NLRP3, CGAS, STING1 expression in cryba1 KO RPE cells treated with FAC and Ad-LCN2 in vitro. Also, STING1 inhibitor treatment (H-151; 1 μM for 6 h) in KO RPE cells exposed to FAC and Ad-LCN2 could rescue the levels of NLRP3 but did not produce noticeable change in STING1 expression, as the inhibitor specifically modulates STING1 activity but does not regulate the expression of STING1. n = 4. All values are Mean ± SD. Significant changes are indicated by *P < 0.05, **P < 0.01.
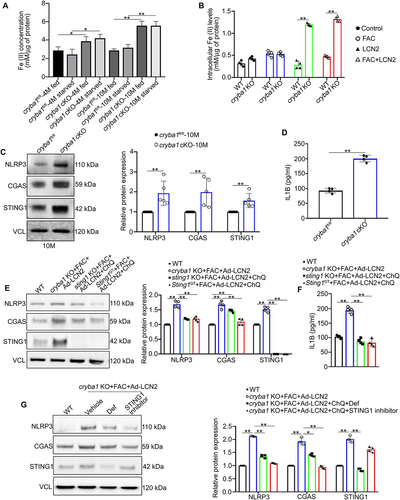
Figure 4. Iron-mediated inflammasome activation triggers oxidative stress and ferroptosis in RPE cells. (a) Western blot analysis and densitometry showing increased levels of the redox sensitive protein, SOD1, but no noticeable change in CAT levels, in the RPE cells of 10-month-old cryba1 cKO mice, compared to age-matched controls. n = 5. (b) Elevated levels of reactive oxygen species (ROS) were observed in RPE lysates from 10-month-old cryba1 cKO mice, compared to age-matched controls. n = 4. (c) Western blot analysis and densitometry showing that treatment with Def (100 μM for 24 h) or STING1 inhibitor (H-151; 1 μM for 6 h) rescued the levels of SOD1 protein in cryba1 KO RPE cells treated with FAC and Ad-LCN2 in vitro. n = 4. (d) ROS levels were also rescued in Def and STING1 inhibitor-treated cultured cryba1 KO RPE explants that were exposed to FAC and Ad-LCN2, compared to vehicle treated group. n = 4. (e) Western blot analysis and densitometry showing increased ferroptosis marker protein, FTH1, in the RPE cells of aged (10 months old) cryba1 cKO mice, compared to age-matched controls. n = 4. (f) Increased levels of malondialdehyde (MDA), a known marker of ferroptosis activation in cells, were observed in the RPE cells of 10-month-old cryba1 cKO mice, compared to age-matched controls. n = 4. Decreased levels of the antioxidant enzyme (g) glutathione peroxidase and (h) SOD activity were also observed in 10-month-old cryba1 cKO mice, compared to controls. n = 4. (i) Live cell imaging in ARPE19 cells loaded with the fluorescent indicator, Liperfluo, which recognizes lipid peroxides that are markers for ferroptosis activation, showed higher liperfluo emission intensity (green) in RSL3 (3 μM for 12 h, positive control; Iii) and FAC+Ad-LCN2+ ChQ (FLC; Iiii) treated cells compared to control (Ii). The ferroptosis inhibitor ferrostatin-1 (25 μM; 12 h) abrogated the changes in the FLC-treated cells (Iiv). (j) Live cell imaging in ARPE19 cells loaded with liperfluo dye showed increased liperfluo fluorescent emissions (green) in FLC (Jii) or FLC+IgG (mouse immunoglobulin, 1 μg/ml for 1 h) treated cells (Jiii), compared to control (Ji). However, treatment with the monoclonal antibody (clone #6 mAb) targeting LCN2 (1 μg/ml for 1 h) could reduce such changes in the FLC-treated cells (Jiv). Scale bar: 50 μm. All values are Mean ± SD or Mean ± SEM (for the live cell imaging assay). n = 2. Significant changes are indicated by *P < 0.05, **P < 0.01.
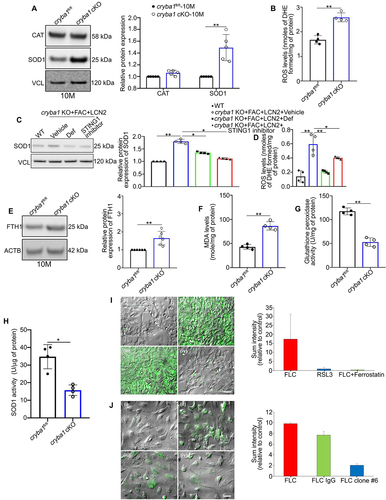
Figure 5. Elevated levels of LCN2 monomer and homodimer in the RPE cells trigger retinal degeneration. (a) Non-denaturing (native) PAGE followed by western blot showing an elevated homodimer: monomer ratio of LCN2 in the RPE cells from 12-month-old cryba1 cKO mice, compared to floxed controls (cryba1fl/fl), n = 4. (b) SDS-PAGE followed by western blot analysis using LCN2 mAb (clone #6) showing elevated levels of the LCN2 homodimer in RPE cells from 12-month-old cryba1 cKO mice, compared to floxed controls, which is reduced to the monomer form upon beta-mercaptoethanol treatment. (c) SDS-PAGE followed by western blot on the SM from floxed RPE explants overexpressing LCN2 showed elevated levels of the LCN2 homodimer only, which was further reduced upon beta-mercaptoethanol treatment. n = 4. (d) Native PAGE followed by western blot showing an increased in homodimer:monomer ratio of LCN2 in the RPE cells from human AMD donors compared to age-matched controls. n = 3. (e) SD-OCT images and a spider plot showing changes in the IS/OS+RPE layer (arrows) in NOD-SCID mice, keeping the optic nerve head (ONH) as the center position, one month after the mice received sub-retinal injections with the SM from LCN2 overexpressing floxed RPE explants. Pre-treatment of the SM with monoclonal antibody against LCN2 (clone #6 mAb), which targets and shows neutralizing property against both variants of LCN2 at a dose of 1 μg/ml for 1 h, followed by sub-retinal injection to the contralateral eye of the same mouse, could partially prevent the structural alterations. n = 4. (f) Representative electroretinography (ERG) wave front on 24 h dark adapted mice showed alterations in both (g) scotopic a- and (h) b-wave responses measured at three different light intensities (0.01, 0.1 and 1 cd*s/m2), suggesting alterations in retinal function in the LCN2 overexpressing SM injected NOD-SCID mice, which was rescued partially, only after exposure to the highest light intensity upon treatment with clone #6 mAb. n = 4. (I) Molecular modeling showing that the LCN2 homodimer (Orange) fails to form the putative complex with ATG4B (purple) and LC3 (green) since the homodimer would compete with LC3 for the same binding area at the ATG4B surface. All values are Mean ± SD. Significant changes is indicated by *P < 0.05, **P < 0.01.
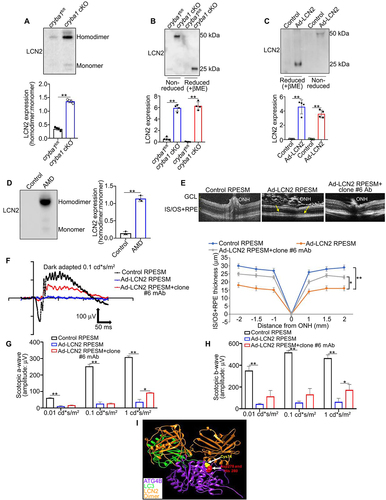
Figure 6. A monoclonal antibody targeting LCN2 rescues salient features of dry AMD in a mouse model. (a) Representative ERG wave form from a 24 h dark adapted 7.5-month-old cryba1 cKO mouse after 2.5 months of treatment with either 1 μg/μl clone #6 mAb or PBS, injected subretinally in the contralateral eyes of the same mouse, respectively. The ERG analysis showed alterations in both (b) scotopic a- and (c) b-wave responses measured at three different light intensities (0.01, 0.1 and 1 cd*s/m2), suggesting significant rescue of the a- and b-wave response after the monoclonal antibody treatment. n = 4. (d) Western blot analysis showing that subretinal injection with the clone #6 mAb in the cryba1 cKO mouse model decreased expression of the autophagosome marker SQSTM1, compared to contralateral eyes that were injected with PBS. n = 4. (e, f) Sub-retinal injection of the clone #6 mAb to 7.5-month-old cryba1 cKO mice for 2.5 months also significantly improved the RPE levels of (e) MDA and (f) glutathione peroxidase activity, compared to the RPE harvested from the PBS-treated contralateral eye of the same mouse. All values are Mean ± SD. Significant changes are indicated by *P < 0.05, **P < 0.01.
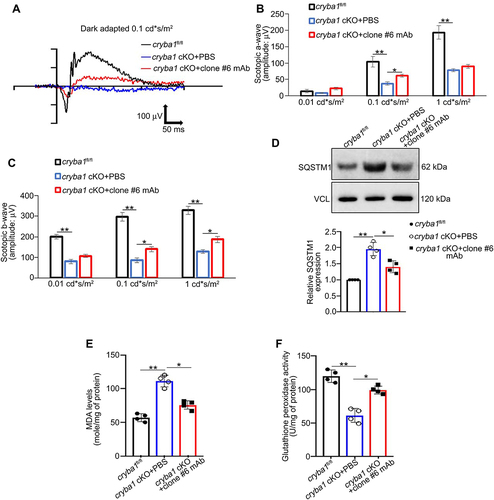
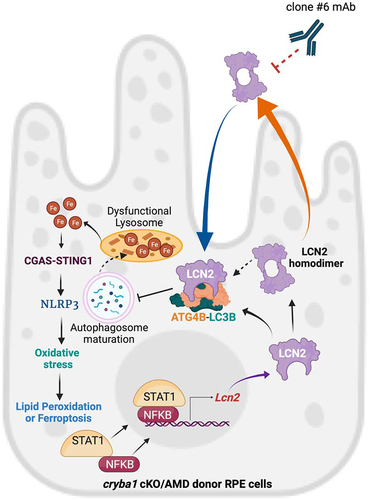
Figure 7. LCN2 deregulates the autophagy process in RPE cells and targeting LCN2 variants with a monoclonal antibody can significantly diminish an AMD-like phenotype in a mouse model. LCN2 upregulation in RPE cells occurs through the activation of the NFκB-STAT1 signaling axis both in the cryba1 cKO mouse model and in human AMD donor samples. Here, we show that LCN2 binds to and regulates the activity of ATG4B by forming a complex with ATG4B and LC3, thereby modulating autophagosome processing (autophagy flux). LCN2 monomer and dimer variants are upregulated in RPE cells from the cryba1 cKO mouse model and human dry AMD donors, while the homodimer variant, the only form secreted from the RPE cells, can trigger retinal degeneration. Further, the homodimer variant is unable to form the complex with ATG4B and LC3. Alterations in autophagosome processing due to LCN2 upregulation accompanied with abnormal lysosomal function in RPE cells trigger abnormal iron accumulation. Alterations in iron homeostasis in RPE cells trigger inflammasome activation through the upregulation of the CGAS-STING1 pathway leading to oxidative stress and ferroptosis. Targeting LCN2 with a monoclonal antibody (clone #6 mAb) that recognizes and neutralizes both LCN2 variants can mitigate the changes in autophagy, lipid peroxidation or ferroptosis and diminish the AMD-like phenotype in a mouse model.