Figures & data
Figure 1. The autophagy level was reduced in human granulosa cells from women with AMA. (A) Senescence-associated GBA/β-galactosidase (SA-GBA/β-gal) staining was performed in granulosa cells from young and old groups. Means and S.E.M of SA-GBA/β-gal-positive cells from at least three independent experiments are indicated. (B) Transmission Electron Microscopy results showed the change in autophagosome number and mitochondrial morphology. Red arrowheads represent autophagosome, and green arrowheads represent mitochondria. Scale bar: 1 μm. (C) Immunofluorescence staining of autophagy markers in ovarian granulosa cells from young and old groups. The accumulation of SQSTM1 is marked in red. Scale bar: 20 μm. (D) Western blot analysis of autophagy related protein expression in ovarian granulosa cells from young and old groups. Normalized quantification of mean gray intensity was determined from 3 separate experiments.
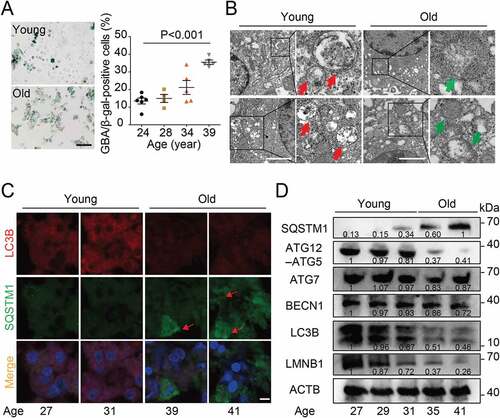
Figure 2. Blocking the autophagy in the granulosa cell decreased the quality of oocyte. (A) The sketch of experimental design for co-cultures. (B) Western blot analysis of autophagy related protein expression in the cells subjected to 3-MA and CQ treatment. Each lane corresponds to an independent biological sample. Normalized quantification of mean gray intensity was determined from 3 separate experiments. (C) Representative images of matured oocytes cultured in vitro from control (n = 30), 3-MA (n = 35), and CQ (n = 35) treatment cumulus granulosa cells. The rate of PB1 was recorded in three independent biological replicates. Scale bar: 80 mm. (D, E, and F) Representative images of cortical granule (CG) distribution (D), meiotic spindle and chromosomes (E), and autophagosomes (F) attachment in control, 3-MA, and CQ treatment groups. Oocytes were immunoassayed with indicated antibody to show the CG, spindles, and LC3-II, respectively. The rate of mis-localized CGs (n = 11) (D), the thickness of spindle middle plate (n = 11). C indicates maximal span of chromosomes; S indicates maximal spindle lengths (E), and the fluorescence intensity of LC3-II (n = 8) (F) were recorded in control, 3-MA, and CQ treated groups. Scale bar: 20 μm. Data in (D), (E) and (F) are presented as mean percentage (mean ± SEM) of at least three independent experiments. *p < 0.05, **p < 0.01, ***p < 0.001 by unpaired two-tailed Student’s t test.
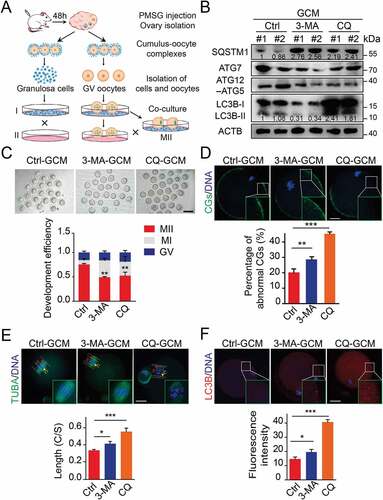
Figure 3. Atg5-mediated cell autophagy promotes oocyte maturation and improves embryo development. (A) Representative images of matured oocytes co-cultured in control and Atg5 knockdown cumulus granulosa cells. The rate of PB1 was recorded from three independent biological replicates to indicate oocyte maturation, n = 40 oocytes in each group. Scale bar: 80 mm. (B, C, and D) Representative images of CG distribution (B), mitochondrial distribution, aggregated mitochondrial in the cytoplasm is marked in red (C), and ROS levels (D) stained with indicated antibody in control and Atg5 knockdown groups. Scale bar: 20 μm. (E) Representative images of sperm binding to the zona pellucida of matured oocytes co-cultured in control and Atg5 knockdown cumulus granulosa cells. The sperm binding to the surface of the zona pellucida surrounding oocytes were counted from control and Atg5 knockdown groups. Scale bar: 20 μm. (F) Representative images of early embryos developed from control (n = 16; n = 20) and Atg5 knockdown (n = 16; n = 23) groups and the rate of 2 cell embryos was recorded. The rate of 2 cell was recorded from three independent biological replicates. Scale bar: 50 μm. The data in (B), (C), (D), and (E) are presented as mean percentage (mean ± SEM) of at least three independent experiments, n = 30 oocytes in each group. ***p < 0.001 by unpaired two-tailed Student’s t test.
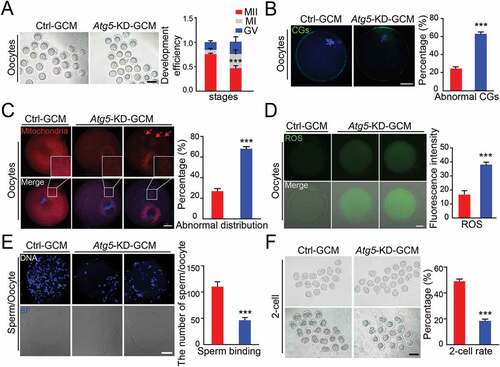
Figure 4. Citrate supplementation improves the quality of oocytes. (A) Heatmap illustration displaying cell culture metabolites of control and Atg5 knockdown groups, classified by metabolic pathways. (Right panel) Violin plots showing the metabolomic level of citrate in control and Atg5 knockdown groups. Mean Raw intensity are indicated by the numerical value. (B) Schematic protocols for citrate supplementation experiment. (Right panel) The rate of PB1 was recorded in control (n = 30), Atg5 knockdown (n = 40), and Atg5 knockdown + citrate (n = 45) groups after maturation for 15 h in vitro, Data are presented as mean percentage (mean ± SEM) of at least three independent experiments. (C, D, and E) Representative images of meiotic spindle and chromosomes (C), mitochondrial distribution (D), and CG distribution (E) in control, Atg5 knockdown and Atg5 knockdown + citrate groups. Oocytes were immunoassayed with indicated antibody to show the spindle, C indicates maximal span of chromosomes; S indicates maximal spindle lengths (C), TOMM20 (D), and CG (E), respectively. Scale bar: 20 μm. (f) Representative images of sperm binding to the zona pellucida of matured oocytes co-cultured in control, Atg5 knockdown and Atg5 knockdown + citrate groups. Scale bar: 20 μm. (G, H, I and J) The rate of aberrant spindles (G), abnormal mitochondria distribution (H), mis-localized CGs (I) and the number of sperm binding to the surface of the zona pellucida surrounding oocytes were recorded in groups, respectively. Data in (G), (H), (I), and (J) are presented as mean percentage (mean ± SEM) of at least three independent experiments. **p < 0. 01, ***p < 0.001 by unpaired two-tailed Student’s t test.
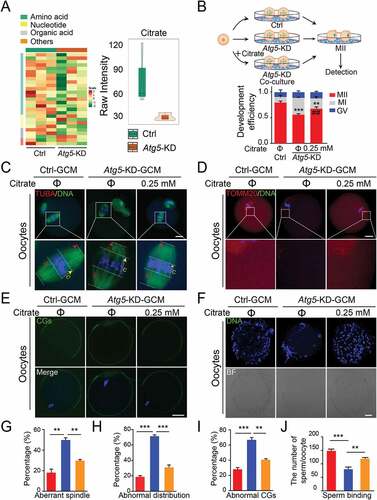
Figure 5. Atg5-mediated autophagy targets ACLY for lysosomal degradation. (A) The mRNA levels of TCA cycle-related genes in the control and Atg5 knockdown cumulus granulosa cells. The values are presented as the means ± SEM, n = 3. N.S represents not significant. (B) The levels of Acly mRNA in the granulosa cells subjected to 3-MA and CQ treatment. The values are presented as the means ± SEM, n = 3. N.S represents not significant. (C) Depletion of the autophagy essential gene Atg5 affects the expression levels of ACLY- SQSTM1 complex. Each lane corresponds to an independent biological sample. Normalized quantification of mean gray intensity was determined from 3 separate experiments. (D) The expression and subcellular location of ACLY and SQSTM1. Granulosa cells co-transfected with or without Atg5 shRNA were treated as indicated inhibitors for 6 h. Confocal images of transfected cells representing the colocalization of ACLY with SQSTM1. ACLY are marked in red, and SQSTM1 are marked in yellow. The merged images and relative arrows reveal the colocalization. Scale bar: 10 μm. (E) Autophagy promotes the degradation of ACLY. Immunoblot analysis of ACLY in granulosa cells with CQ (50 μM) or MG132 (10 μM) treatment for 6 h. Quantification of protein by calculating the ratio of ACLY:SQSTM1 with ACTB. Error bars indicate the SD (n = 3). Each lane corresponds to an independent biological sample. (F) ACLY is stabilized in Atg5 knockdown cells. Granulosa cells silenced with control, Atg5 shRNA were then treated with CHX for the indicated time. The percentage of remaining ACLY protein was calculated from the intensity of CHX treatment immunoblots, measured in three biological replicates.
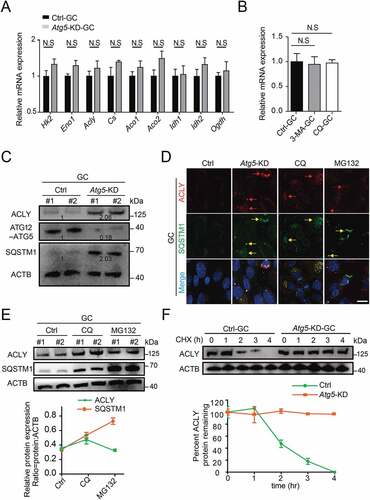
Figure 6. K63-linked polyubiquitination of ACLY facilitates its selective autophagic degradation by interacting with SQSTM1. (A) ACLY with Lys63-linked poly-ubiquitin chains were stabilized after inhibition of autophagy. Granulosa cells were co-transfected with or without Atg5 shRNA, and the cell lysates were immunoprecipitated to affinity isolate the endogenous ACLY protein, and the polyubiquitinated linkage site was detected using indicated antibodies. Each lane corresponds to an independent biological sample. (B) ACLY is preferentially tagged by Lys63-linked poly-ubiquitin chains. HEK293T cells were co-transfected with plasmids expressing MYC-ACLY together with either wild-type, Lys63, or Lys48 HA-Ub. (C) Ubiquitination levels of ACLY after SQSTM1 overexpression. HEK293T cells were transfected with MYC-ACLY along with the indicated plasmids. 24 h after transfection, immunoprecipitation and immunoblot analysis were performed with the indicated antibodies. (D) SQSTM1 targets K63-linked ACLY for degradation by its UBA domain. Granulosa cells were transfected with MYC-tagged ACLY and FLAG-tagged wild-type SQSTM1 or its UBA domain deletion variant. (E) SQSTM1 interacts with ACLY. Endogenous SQSTM1 was immunoprecipitated with an antibody against SQSTM1. ACLY was detected by western blotting. (F) ACLY is stabilized in sqstm1 knockout cells. Control or CRISPR/Cas9-mediated sqstm1 KO granulosa cells were then treated with CHX for the indicated time. The percentage of remaining ACLY protein was calculated from the intensity of CHX treatment immunoblots, measured in three biological replicates.
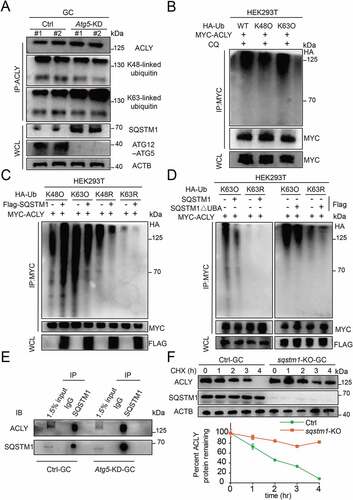
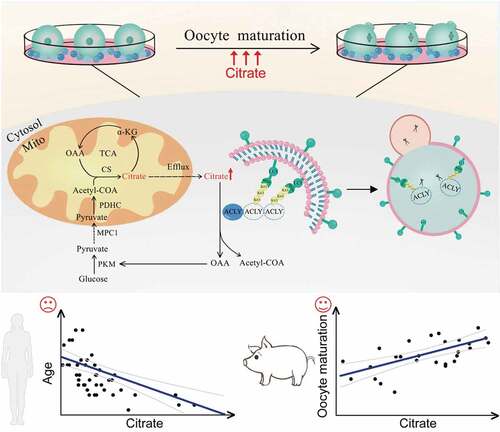
Figure 7. Elevated citrate levels in mammalian follicular fluid promote oocyte maturation. (A) A schematic showing the procedure for human follicular fluid (hFF) isolation. (B) The negative correlation of citric acid levels with age in hFF. n = 42. (C) The porcine follicular fluid (pFF) citric acid levels in different sizes of porcine follicles. n = 27. D indicated diameter of follicle. Data are expressed as mean ±SEM. ***p < 0.001. (D) The positive correlation of citric acid levels with porcine oocyte maturation. n = 27. Correlation and corresponding statistical significance were calculated based on Spearman’s rank correlation coefficient (R) in R language. (E) Representative images of porcine oocytes in vitro maturation. (F) Average polar body rate of porcine oocytes in control (n = 6) and citrate treated groups (n = 6). Data are expressed as mean ±SEM. ***p < 0.001. The lines in (b) and (d) indicates the 0.95 confidence interval around smooth. ***p < 0.001 by unpaired two-tailed Student’s t test with R language.
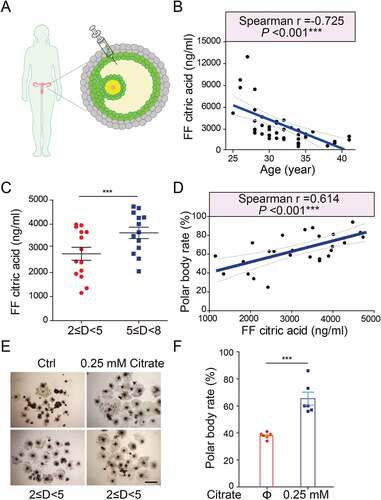
Figure 8. A proposed model for the selective autophagic degradation of ACLY and oocyte maturation regulated by citrate metabolism. During the oocyte maturation process, autophagy in granulosa cells was highly activated to selectively degrade K63-linked ubiquitinated ACLY in an SQSTM1-dependent manner, which further raises the concentration of citrate and promotes mouse oocyte maturation. The citrate concentration in human follicular fluid was negatively correlated with age, while porcine follicles with higher citrate levels had a correspondingly higher oocyte maturation rate.