
Figures & data
Figure 1. Translocation of DNAJC5 into the lumen of endolysosomes. (A) The Keima-based endolysosome translocation assay. (B and C) Keima-DNAJC5 but not Keima is efficiently translocated into endolysosomes. HEK293T cells stably expressing Keima or Keima-DNAJC5 were analyzed by confocal microscopy using Ex440/Em610 (neutral) or Ex550/Em610 (acidic). (B) scale bar: 5 μm. (C) Representative Em610 population analysis of the Keima or Keima-DNAJC5 fluorescence intensity at Ex440 nm (neutral) and Ex550 nm (acidic) in stable cells using flow cytometry. (D) Flow cytometry analysis of Keima-DNAJC5 cells as (C) before and after bafilomycin A1 (200 nM, 2 h) treatment. FL, fluorescence. (E) Deletion of the J-domain stimulates DNAJC5 endolysosome translocation. The ratio of acidic vs. neutral fluorescence signals in cells stably expressing the indicated Keima proteins was analyzed by FACS. (F and G) Keima-DNAJC5 is translocated into endolysosomes in primary neurons. Mouse primary hippocampal neurons (DIV 10) expressing either Keima, Keima-DNAJC5 WT or ΔJ proteins were analyzed by confocal microscopy. The white dotted lines indicate nuclei. (G) shows the ratio of acidic vs. neutral fluorescence (mean intensity) in each image (n = 11 images from two independent experiments) measured by the Zeiss Zen (black) software. Note that treatment of bafilomycin A1 (100 nM, 6 h) abolished the acidic signals in neurons. Error bars indicate mean ± s.e.m. ****, p < 0.0001 by one-way ANOVA plus Tukey’s multiple comparisons test.
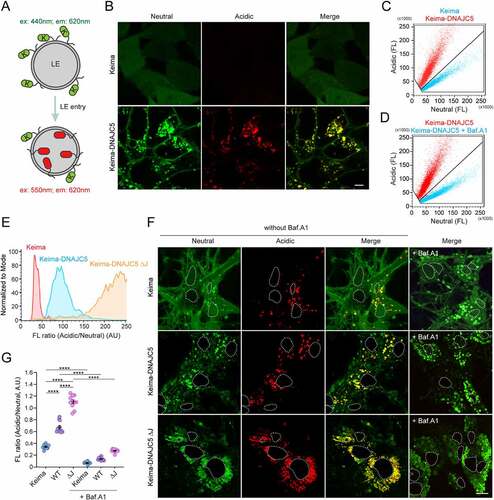
Figure 2. DNAJC5-mediated microautophagy is dispensable for MAPS. (A-C) DNAJC5 promotes the association of misfolded proteins with endolysosomes. (A) Panels i–iii, COS-7 cells transfected with mCh-GFP1-10 together with either empty vector (EV) or photoactivatable GFP (paGFP)-tagged DNAJC5 WT or DNAJC5 ΔJ were subject to repeated photobleaching in the indicated areas, which reveals vesicle-associated mCh-GFP1-10 (arrowheads). The number of mCh-GFP1-10-containing vesicles in individual cells are shown in (B). Error bars indicate mean ± s.e.m. **, p < 0.005 (p = 0.0023); ****, p < 0.0001 by one-way ANOVA plus Dunnett’s multiple comparisons test; n = 50, 43, and 34 cells respectively from 3 independent experiments. Panels iv–vi show the colocalization of mCh-GFP1-10 with paGFP-DNAJC5 ΔJ. Panels vii–ix, cells transfected with mCh-GFP1-10, DNAJC5 ΔJ, and mCi-Rab9 show the colocalization of mCh-GFP1-10 with RAB9. (C) U2OS cells stably expressing mCh-SNCA were transfected with mCerulean (mCe)-DNAJC5 and LAMP1-YFP and imaged. The right panels show enlarged views from another cell. Scale bars: 5 μm. (D and E) DNAJC5 promotes the endolysosomal translocation of Keima-SNCA. Keima-SNCA stable HEK293T cells transfected with the indicated plasmids together with a CFP-expressing plasmid were imaged. CFP serves as a control for transfected cells. Scale bar: 5 μm. (E) shows the number of acidic Keima-SNCA-containing vesicles in individual cells in (D). Error bars indicate mean ± s.e.m. **, p < 0.005 (p = 0.0048); ***, p < 0.0005 (p = 0.0003); ****, p < 0.0001 by one-way ANOVA plus Dunnett’s multiple comparisons test. n = 63, 46, 48, and 77 cells respectively from 3 independent experiments. (F) VPS4 DN inhibits the endolysosomal translocation of Keima-DNAJC5. Keima-DNAJC5 stable cells were treated with bafilomycin A1 or transfected with either an empty vector or VPS4 DNE228Q-expressing plasmid, and then analyzed by FACS. (G-I) DNAJC5-mediated secretion of misfolded proteins is independent of endolysosomal translocation. Conditioned medium and cell lysates from HEK293T cells transfected with GFP1-10 together with the indicated plasmids were analyzed by immunoblotting. LC, loading control. (I) Quantification of the secreted GFP1-10 normalized by GFP1-10 in cell lysates. Error bars indicate mean ± s.e.m. of fold changes relative to E.V. control (dotted line), from n = 3 independent experiments. ***, p < 0.005 (p = 0.0002 for both) by one-way ANOVA plus Tukey’s multiple comparisons test.
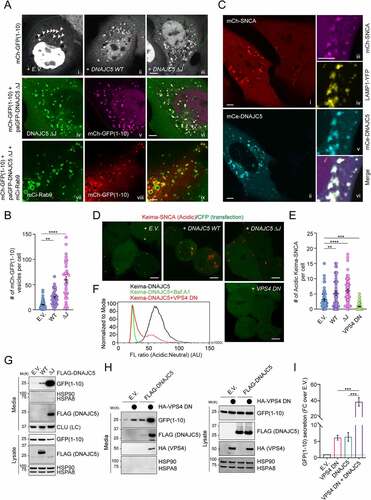
Figure 3. ANCL-associated DNAJC5 mutants are defective in MAPS but capable of translocating substrates into endolysosomes. (A and B) The DNAJC5L115R and L116Δ mutants promote the association of mCh-SNCA with endolysosomes similarly as WT DNAJC5. Representative images of mCh-SNCA-expressing U2OS cells transfected with the indicated plasmids. Scale bar: 5 μm. (B) Quantification of mCh-SNCA-containing vesicles in individual cells in A. Error bars indicate mean ± s.e.m. ****, p < 0.0001 by one-way ANOVA plus Dunnett’s multiple comparisons test; n = 37, 33, 31, and 45 cells respectively from 3 independent experiments. (C and D) The DNAJC5L115R and L116Δ mutants can still promote the translocation of Keima-SNCA into endolysosomes. (C) Representative images of Keima-SNCA cells transfected with the indicated plasmids together with CFP. Scale bar: 5 μm. (D) Quantification of mCh-SNCA-containing vesicles in individual cells in (C). Error bars indicate mean ± s.e.m. **, p < 0.005 (p = 0.0026); ****, p < 0.0001 by one-way ANOVA plus Dunnett’s multiple comparisons test; n = 81, 60, 69 and 88 cells respectively from 3 independent experiments. (E and F) The ANCL-associated DNAJC5 mutants are translocated into endolysosomal lumen more efficiently than WT DNAJC5. (E) Representative histograms show the ratio of acidic vs. neutral fluorescence intensity in cells transfected with the indicated plasmids. As a control, cells expressing WT DNAJC5 were treated with bafilomycin A1 (200 nM) for 2 h. The line indicates the threshold by which cell populations were assigned and analyzed in (F). (F) Quantification of cell populations as indicated in (E) in cells transfected with the indicated plasmids. Error bars indicate mean ± s.e.m.; **, p < 0.005 (p = 0.0016); ****, p < 0.0001 by one-way ANOVA plus Dunnett’s multiple comparisons test; n = 3 experiments. (G-I) The ANCL-associated DNAJC5 mutants are defective in MAPS. Conditioned medium and cell lysates from cells transfected with GFP1-10 together with the indicated plasmids were analyzed by immunoblotting. LC, loading control. The graph in (H) shows the quantification of the secreted GFP1-10 normalized by GFP1-10 in cell lysates. Error bars indicate mean ± s.e.m. of fold changes relative to E.V. control (dotted line), from n = 4 independent experiments. ****, p < 0.0001; n.s, not significant by one-way ANOVA plus Tukey’s multiple comparison test. The graph in (I) shows the secretion of DNAJC5 from n = 3 independent experiments. Error bars indicate mean ± s.e.m. of fold changes relative to WT (dotted line), from n = 3 independent experiments. ****, p < 0.0001 by one-way ANOVA plus Dunnett’s multiple comparisons test.
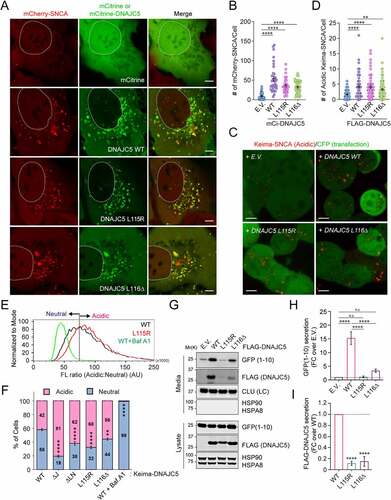
Figure 4. The linker domain localizes DNAJC5 to a perinuclear LAMP1-negative compartment and is required for MAPS. (A) A 3-D view of the subcellular localization of endogenous LAMP1 and DNAJC5 in HEK293T cells. HEK293T cells expressing DNAJC5 bearing an endogenously tagged GFP at the C-terminus (DNAJC5::GFP) were stained with LAMP1 antibodies in red and DAPI in blue. Confocal images of z-stacks were reconstituted into a 3D view using the Nikon element software. The large image only shows the green and blue channel to highlight perinuclear DNAJC5 clusters (arrows). The inset is an enlarged view of the box-indicated area showing partially colocalization of DNAJC5-GFP with LAMP1. (B and C) DNAJC5 localization to a LAMP1-negative perinuclear compartment requires the LN domain. (B) Representative confocal images of U2OS cells transfected with LAMP1-mCh together with the indicated mCitrine (mCi)-tagged DNAJC5 variants. Scale bars: 5 μm. (C) Quantification of the colocalization efficiency of various DNAJC5 variants with LAMP1-mCh in individual cells in B. Error bars indicate mean ± s.e.m. ****, p < 0.0001; n.s, not significant by one-way ANOVA plus Dunnett’s multiple comparisons test; n = 60, 66, 47, 60 and 45 cells respectively from 3 independent experiments. (D) A scheme illustrates the various DNAJC5 variants tested in B and E. (E) The LN domain is required for DNAJC5 secretion. Conditioned medium and cell lysates from HEK293T cells expressing the indicated DNAJC5 variants were analyzed by immunoblotting. LC, loading control. (F) Quantification of the DNAJC5 secretion experiments shown in D. Error bars indicate mean ± s.e.m. of fold changes relative to WT (dotted line), from n = 3 independent experiments. ***, p < 0.0005 (p = 0.0006, 0.0002 and 0.0003, respectively) by one-way ANOVA plus Dunnett’s multiple comparisons test.
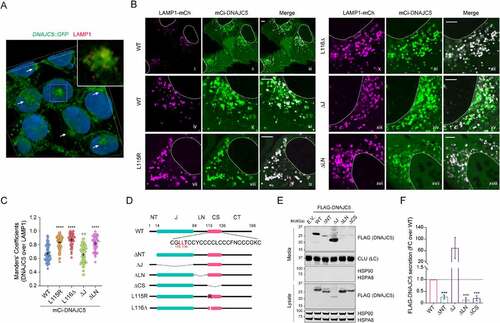
Figure 5. SLC3A2 interacts with DNAJC5 via the LN domain and is required for the perinuclear localization of DNAJC5. (A) A silver-stained gel showing the proteins co-purified with DNAJC5 ΔJ-SBP-FLAG. (B) Co-immunoprecipitation and immunoblotting confirm the interaction of both WT DNAJC5 and DNAJC5 ΔJ with endogenous SLC3A2. (C) The LN domain is required for DNAJC5 interaction with SLC3A2. SLC3A2::GFP cells were transfected with the indicated DNAJC5 variants for GFP-Trap and immunoblotting. The graph shows the quantification of SLC3A2-associated DNAJC5 normalized to DNAJC5 in cell lysates. Error bars indicate mean ± s.e.m. of fold changes relative to WT (dotted line). *, p < 0.05 (p = 0.0134 and 0.0446, respectively); n.s, not significant by one-way ANOVA plus Dunnett’s multiple comparisons test from at least 3 independent experiments. (D and E) Colocalization of endogenous DNAJC5 and SLC3A2. U2OS cells (in [D]) or HEK293 cells (in [E]) bearing GFP and mCherry tag on SLC3A2 and DNAJC5 respectively were imaged by dual-color confocal microscopy. (E) Representative frames from movie S1. Scale bars: 5 μm. (F-H) Depletion of SLC3A2 abolishes a perinuclear pool of DNAJC5. (F) Representative images from control or SLC3A2 knockout (KO) U2OS cells stained by DNAJC5 and LAMP1 antibodies. The arrows indicate perinuclear pool of DNAJC5. Scale bars: 5 μm. (G) Quantification of the colocalization efficiency of DNAJC5 and LAMP1 in (F). Error bars indicate mean ± s.e.m. ****, p < 0.0001 by one-way ANOVA plus Dunnett’s multiple comparisons test; n = 156 and 106 cells respectively from 3 independent experiments. (H) Immunoblotting confirms the depletion of SLC3A2 in CRISPR KO cells.
![Figure 5. SLC3A2 interacts with DNAJC5 via the LN domain and is required for the perinuclear localization of DNAJC5. (A) A silver-stained gel showing the proteins co-purified with DNAJC5 ΔJ-SBP-FLAG. (B) Co-immunoprecipitation and immunoblotting confirm the interaction of both WT DNAJC5 and DNAJC5 ΔJ with endogenous SLC3A2. (C) The LN domain is required for DNAJC5 interaction with SLC3A2. SLC3A2::GFP cells were transfected with the indicated DNAJC5 variants for GFP-Trap and immunoblotting. The graph shows the quantification of SLC3A2-associated DNAJC5 normalized to DNAJC5 in cell lysates. Error bars indicate mean ± s.e.m. of fold changes relative to WT (dotted line). *, p < 0.05 (p = 0.0134 and 0.0446, respectively); n.s, not significant by one-way ANOVA plus Dunnett’s multiple comparisons test from at least 3 independent experiments. (D and E) Colocalization of endogenous DNAJC5 and SLC3A2. U2OS cells (in [D]) or HEK293 cells (in [E]) bearing GFP and mCherry tag on SLC3A2 and DNAJC5 respectively were imaged by dual-color confocal microscopy. (E) Representative frames from movie S1. Scale bars: 5 μm. (F-H) Depletion of SLC3A2 abolishes a perinuclear pool of DNAJC5. (F) Representative images from control or SLC3A2 knockout (KO) U2OS cells stained by DNAJC5 and LAMP1 antibodies. The arrows indicate perinuclear pool of DNAJC5. Scale bars: 5 μm. (G) Quantification of the colocalization efficiency of DNAJC5 and LAMP1 in (F). Error bars indicate mean ± s.e.m. ****, p < 0.0001 by one-way ANOVA plus Dunnett’s multiple comparisons test; n = 156 and 106 cells respectively from 3 independent experiments. (H) Immunoblotting confirms the depletion of SLC3A2 in CRISPR KO cells.](/cms/asset/43e68226-5827-44ac-a6e6-7b283da910de/kaup_a_2065618_f0005_oc.jpg)
Figure 6. Depletion of SLC3A2 inhibits MAPS and causes the accumulation of AFSMs in cells. (A) Depletion of SLC3A2 inhibits GFP1-10 secretion. Conditioned medium and cell lysates from the control or SLC3A2 KO cells transfected with GFP1-10 and the indicated plasmids were analyzed by immunoblotting. (B) As in A, except that cells transfected with FLAG-SNCA and the indicated plasmids were analyzed. (C) Quantification of the experiments in A (n = 4). Error bars indicate mean ± s.e.m. of fold changes relative to E.V control in SLC3A2 WT cell (dotted line). ****, p < 0.0001; *, p < 0.05 (p = 0.017) by Tukey’s multiple comparisons test. (D) Quantification of the experiments in (B) (n = 3). Error bars indicate mean ± s.e.m. of fold changes as seen in (C). **, p < 0.01 (p = 0.0082); *, p < 0.05 (p = 0.0183); n.s, not significant by Tukey’s multiple comparisons test. (E) Quantification of the DNAJC5 secretion from the experiments in (A) and (B). Error bars indicate mean ± s.e.m. of fold changes relative to SLC3A2 WT cell, from n = 4 independent experiments. ****, p < 0.0001 by one-tailed t-test. (F-J) SLC3A2 deficient cells contain AFSMs resembling NCL-associated lipofuscin. (F) Control (Ctrl.) KO or SLC3A2 KO HEK293T cells were transfected with mCherry (mCh) or SLC3A2-mCh and imaged by confocal microscopy. The dashed lines indicate cell boundary. Arrow indicates a “lysobody” in a cell without SLC3A2-mCh. (G) Enlarged images of SLC3A2 KO cells stained by either DNAJC5 antibodies (Top panels) or transfected with mCh-Rab9 (Bottom panels) show that AFSMs are surrounded by DNAJC5- and RAB9-positive membranes. (H) SLC3A2 KO U2OS cells stained with saposin A1 antibodies in red. (I) Fibroblast cells from NCL2 patients were stained with DNAJC5 antibodies. (J) HEK293T cells transfected with the indicated DNAJC5 variants were stained by saposin A1 antibodies in red. Scale bars: 5 μm.
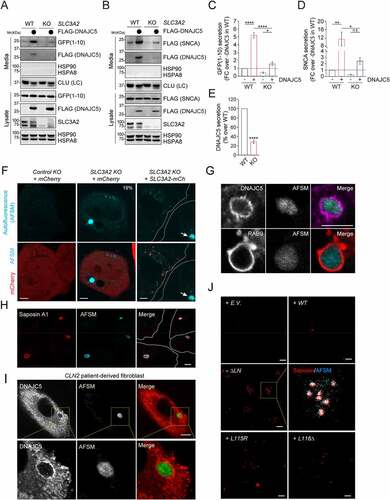
Figure 7. AFSM accumulation and genetic interaction between DNAJC5 and SLC3A2 in a fly ANCL model. (A and Ai) The expression of human DNAJC5L116Δ but not DNAJC5 WT in fly photoreceptor cells causes a severe rough eye phenotype. (B-D) AFSM accumulation in photoreceptor cells in larvae expressing human DNAJC5L116Δ. (B-Bi) Imaginal eye discs from GMR>HsDNAJC5 WT or GMR>HsDNAJC5L116Δ were stained with phalloidin to label cortex actin (red) and imaged at Ex405 to detect AFSM. (C-Ci) An enlarged view of a cluster of photoreceptor cells bearing AFSMs (arrows) in the cytoplasm. (D) A 3D side view of AFSM in a DNAJC5L116Δ-expressing eye disc. (A) apical; (B) Basal. (E-Eiii) dSlc3a2 knockdown enhances the rough eye phenotype associated with HsDNAJC5 WT expression at 28°C. (F) The DNAJC5-mediated protein triaging pathways, and the deregulation of these processes in cells expressing ANCL-associated DNAJC5 mutants. The illustration was created by Biorender. PM, plasma membrane; PNC, perinuclear compartments; eMI, endosomal microautophagy; MVB, multivesicular bodies.
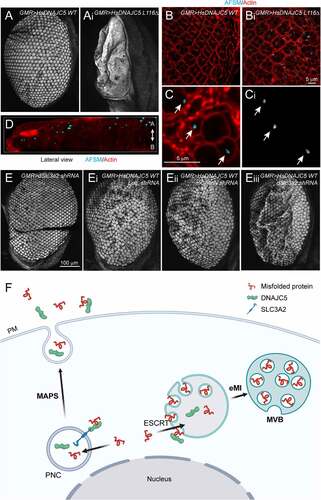
Table 1. Table with information about plasmids, siRNAs, chemicals, and antibodies.