Figures & data
Figure 1. Autophagy activation is required for longevity of sams-1 mutants. (a) GFP::LGG-1-positive puncta were quantified in the hypodermal seam cells (top panel) and body-wall muscle (bottom panel) of day 1 adult WT and sams-1(ok2946) animals expressing lgg-1p::gfp::lgg-1. Graphs show mean SEM of GFP::LGG-1 puncta in hypodermal seam cells (WT: N = 124; sams-1(ok2946): N = 97 cells) and body-wall muscles (WT: N = 78; sams-1(ok2946): N = 53 worms) combined from three independent experiments. Scale bar: 25 µm. ****P < 0.0001, Student’s t-test. (b) GFP and mCherry fluorescent images of day 1 adult worms expressing gfp::lgg-1::mcherry::lgg-1ΔG fed with empty vector (EV) or sams-1 RNAi bacteria from hatching. Scale bar: 100 µm. Graph shows the relative GFP:mCherry fluorescence signal ratio of individual worms, normalized to the mean of EV. Mean
SD are shown (EV: N = 23; sams-1 RNAi: N = 27 worms). ****P < 0.0001, Student’s t-test. (c) Lifespan analyses of N2 and sams-1(ok2946) worms fed with EV or bec-1 RNAi (left panel), vps-34 RNAi (middle panel), lgg-1/lgg-2 RNAi (right panel) bacteria from day 1 adulthood at 20°C. Please see Table S1 for detailed statistics.
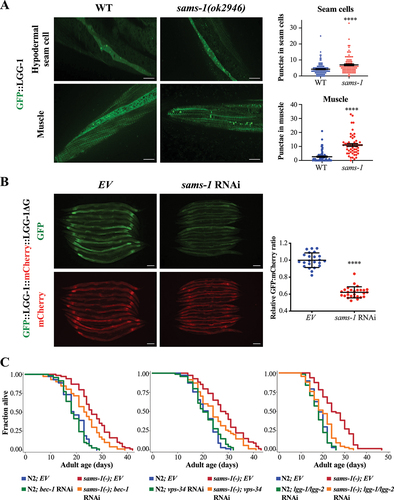
Figure 2. HLH-30/TFEB and PHA-4/FOXA mediate autophagy and longevity of sams-1 mutants. (a) Representative HLH-30::GFP immunoblot of worms expressing hlh-30::gfp fed with empty vector (EV) or sams-1 RNAi bacteria. Worms were fed with respective bacteria from hatching and the whole-cell extracts of adult day 1 worms were subjected to immunoblotting using anti-GFP or anti-actin antibodies. Graph shows abundance of HLH-30::GFP normalized to actin. Mean SD of three independent experiments are shown. **P < 0.01, Student’s t-test. (b) Representative PHA-4::GFP immunoblot of worms expressing pha-4::gfp fed with EV or sams-1 RNAi bacteria. Worms were fed with respective bacteria from hatching and the whole-cell extracts of adult day 1 worms were subjected to immunoblotting using anti-GFP or anti-actin antibodies. Graph shows abundance of PHA-4::GFP normalized to actin. Mean
SD of three independent experiments are shown. *P < 0.05, Student’s t-test. (c) Relative mRNA abundance of hlh-30, pha-4, autophagy-related genes and sodh-1, an HLH-30 and PHA-4 target gene, in N2 and sams-1(ok2946) worms at L4 larvae stage by QPCR analysis. Mean
SD of three to five independent experiments are shown. *P < 0.05, ***P < 0.001, ****P < 0.0001, Student’s t-test. (d) Nuclear localization of HLH-30::GFP was visualized in day 1 adult worms expressing hlh-30::gfp. Eggs of worms expressing hlh-30::gfp were placed on plates supplemented with H2O (left panel). Eggs of sams-1(ok2946) worms expressing hlh-30::gfp were placed on plates supplemented with H2O (middle panel) or 20 µM SAM (right panel). Representative images are shown. Scale bar: 25 µm. HLH-30::GFP nuclear:cytoplasmic ratio in int1 intestinal cells of WT and sams-1(ok2946) worms expressing hlh-30::gfp was calculated. Mean
SD (N = 50 cells) are shown. ****P < 0.0001, Student’s t-test. (e and f) Graphs show the relative GFP:mCherry fluorescence signal ratio of WT or sams-1(ok2946) (E), eat-2 (ad1116) (F) worms expressing gfp::lgg-1::mcherry::lgg-1ΔG fed with EV, hlh-30 or pha-4 RNAi bacteria. Worms were fed with EV, hlh-30 or pha-4 RNAi bacteria from hatching, and L4 worms were imaged. The relative GFP:mCherry fluorescence signal ratio of individual worms was normalized to the mean of WT worms fed with EV bacteria. (e) Graph shows mean
SD of WT (EV: N = 30; hlh-30 RNAi: N = 30; pha-4 RNAi: N = 28 worms) and sams-1(ok2946) mutants (EV: N = 40; hlh-30 RNAi: N = 26; pha-4 RNAi: N = 21 worms). (f) Graph shows mean
SD of WT (EV: N = 28; hlh-30 RNAi: N = 29; pha-4 RNAi: N = 23 worms) and eat-2(ad1116) mutants (EV: N = 49; hlh-30 RNAi: N = 32; pha-4 RNAi: N = 52 worms). ***P < 0.001, ****P < 0.0001, Two-way ANOVA with Tukey’s multiple comparison test. (g and h) Lifespan analyses of N2 and sams-1(ok2946) worms fed with EV or hlh-30 RNAi (G), pha-4 RNAi (H) bacteria from day 1 adulthood at 20°C. Please see Table S1 for detailed statistics.
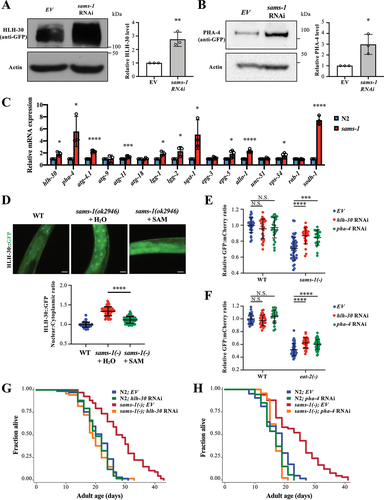
Figure 3. SET-2, an H3K4 methyltransferase, modulates autophagy via HLH-30/TFEB and PHA-4/FOXA. (a) HLH-30::GFP nuclear:cytoplasmic ratio in int1 intestinal cells of WT, set-2(bn129) and sams-1(ok2946) worms expressing hlh-30::gfp. Mean SD are shown (N = 50 cells). ****P < 0.0001, One-way ANOVA with Tukey’s multiple comparison test. (b) Representative HLH-30::GFP immunoblot of worms expressing hlh-30::gfp fed with EV or set-2 RNAi bacteria. Worm were fed with respective bacteria from hatching and the whole-cell extracts of adult day 1 worms were subjected to immunoblotting using anti-GFP or anti-actin antibodies. Graph shows abundance of HLH-30::GFP normalized to actin. Mean
SD of three independent experiments are shown. *P < 0.05, Student’s t-test. (c) Representative PHA-4::GFP immunoblot of worms expressing pha-4::gfp fed with EV or set-2 RNAi bacteria. Worm were fed with respective bacteria from hatching and the whole-cell extracts of adult day 1 worms were subjected to immunoblotting using anti-GFP or anti-actin antibodies. Graph shows abundance of PHA-4::GFP normalized to actin. Mean
SD of three independent experiments are shown. **P < 0.01, Student’s t-test. (d) Relative hlh-30 and pha-4 mRNA abundance in N2 and set-2(bn129) worms at L4 larvae stage by QPCR analysis. Mean
SD of three independent experiments are shown. *P < 0.05, ***P < 0.001, Student’s t-test. (e) GFP::LGG-1-positive puncta were quantified in the body-wall muscle, proximal intestinal cells, terminal pharyngeal bulb and hypodermal seam cells of day 1 adult WT and set-2(ok952) expressing lgg-1p::gfp::lgg-1 or lgg-1::gfp::lgg-1(G116A). Graphs show mean
SEM of GFP::LGG-1 puncta in body-wall muscles (WT-LGG-1: N = 66; WT-LGG-1(G116A): N = 46; set-2(ok952)-LGG-1: N = 54; set-2(ok952)-LGG-1(G116A): N = 51 worms), proximal intestinal cells (WT-LGG-1: N = 63; WT-LGG-1(G116A): N = 58; set-2(ok952)-LGG-1: N = 58; set-2(ok952)-LGG-1(G116A): N = 62 cells), terminal pharyngeal bulb (WT-LGG-1: N = 29; WT-LGG-1(G116A): N = 30; set-2(ok952)-LGG-1: N = 30; set-2(ok952)-LGG-1(G116A): N = 32 worms) and hypodermal seam cells (WT-LGG-1: N = 90; WT-LGG-1(G116A): N = 104; set-2(ok952)-LGG-1: N = 83; set-2(ok952)-LGG-1(G116A): N = 92 cells). *P < 0.05, ****P < 0.0001, Two-way ANOVA with Tukey’s multiple comparison test.(f) GFP and mCherry fluorescent images of day 1 adult WT and set-2(bn129) worms expressing gfp::lgg-1::mcherry::lgg-1ΔG. Scale bar: 100 µm. Graph shows the relative GFP:mCherry fluorescence signal ratio of individual worms, normalized to the mean of WT. Mean
SD are shown (WT: N = 24; set-2(bn129): N = 23 worms). ****P < 0.0001, Student’s t-test. (g) Graph shows the relative GFP:mCherry fluorescence signal ratio of WT or set-2(bn129) worms expressing gfp::lgg-1::mcherry::lgg-1ΔG fed with EV, hlh-30 or pha-4 RNAi bacteria. Worms were fed with EV, hlh-30 or pha-4 RNAi bacteria from hatching, and L4 worms were imaged. The relative GFP:mCherry fluorescence signal ratio of individual worms was normalized to the mean of WT worms fed with EV bacteria. Graph shows mean
SD of WT (EV: N = 24; hlh-30 RNAi: N = 23; pha-4 RNAi: N = 25 worms) and set-2(bn129) mutants (EV: N = 21; hlh-30 RNAi: N = 21; pha-4 RNAi: N = 24 worms). **P < 0.01, ****P < 0.0001, Two-way ANOVA with Tukey’s multiple comparison test.
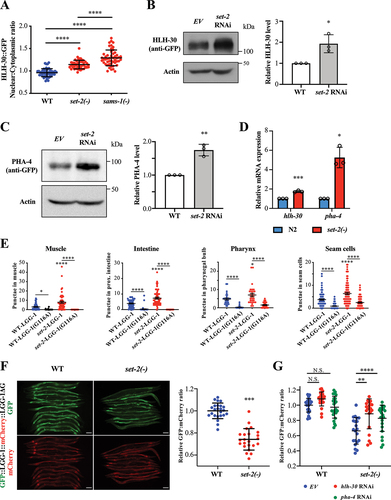
Figure 4. SET-2 acts in the DR pathway and requires autophagy-related genes to promote longevity. (a) Lifespan analysis of N2 and set-2 OE worms fed with empty vector (EV) or sams-1 RNAi bacteria from hatching at 20°C. (b) Lifespan analysis of N2, set-2 OE, eat-2(ad1116), and eat-2(ad1116);set-2 OE worms fed on OP50 at 20°C. (c-f) Lifespan analyses of N2 and set-2(ok952) worms fed with EV or hlh-30 RNAi (C), pha-4 RNAi (D), vps-34 RNAi (E), lgg-1/lgg-2 RNAi (F) bacteria from day 1 adulthood at 20°C. Please see Table S1 for detailed statistics.
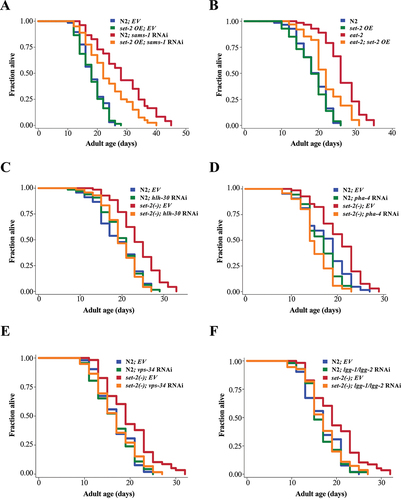
Figure 5. AMX-1 H3K4 demethylase antagonizes SET-2 in the regulation of HLH-30/TFEB. (a) HLH-30::GFP nuclear:cytoplasmic ratio in int1 intestinal cells of day 2 adult worms expressing hlh-30::gfp. The worms were fed with empty vector (EV) or sams-1 RNAi bacteria from hatching and transferred to EV or amx-1 RNAi bacteria at L4 stage. Mean SD are shown (N = 50 cells). ****P < 0.0001, One-way ANOVA with Tukey’s multiple comparison test. (b) HLH-30::GFP nuclear:cytoplasmic ratio in int1 intestinal cells of day 1 adult eat-2(ad1116) (left panel) or set-2(bn129) (right panel) mutants expressing hlh-30::gfp. The worms were fed with EV or amx-1 RNAi bacteria from hatching. Mean
SD are shown (N = 50 cells). ****P < 0.0001, Student’s t-test. (c) Relative hlh-30 mRNA abundance in L4 larvae of eat-2(ad1116) (left panel) or set-2(bn129) (right panel) worms fed with EV or amx-1 RNAi bacteria from hatching by QPCR analysis. Mean
SD of three independent experiments are shown. *P < 0.05, ***P < 0.001, ****P < 0.0001, Student’s t-test. (d) Graph shows the relative GFP:mCherry fluorescence signal ratio of day 1 adult worms expressing gfp::lgg-1::mcherry::lgg-1ΔG fed with EV or amx-1 RNAi bacteria followed by EV or sams-1 RNAi bacteria. Worms were first fed with EV or sams-1 RNAi bacteria from hatching. L3/L4 larvae were then transferred to plates seeded with EV or amx-1 RNAi bacteria and the day 1 adult worms were imaged. The relative GFP:mCherry fluorescence signal ratio of individual worms was normalized to the mean of EV. Mean
SD are shown (EV: N = 24; amx-1 RNAi: N = 24; sams-1 RNAi: N = 24; sams-1 + amx-1 RNAi: N = 25 worms). ****P < 0.0001, for interaction between two variables in Two-way ANOVA.Two-way ANOVA. (e-g) Lifespan analyses of N2 and sams-1(ok2946) (E), set-2(ok952) (F), eat-2(ad1116) (G) worms fed with EV or amx-1 RNAi bacteria from day 1 adulthood at 20°C. Please see Table S1 for detailed statistics.
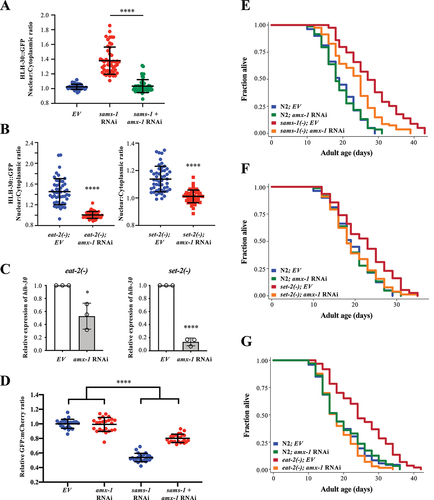
Figure 6. SET-2 and AMX-1 modulate H3K4me3 level to control HLH-30/TFEB and PHA-4/FOXA expression. (a) Representative H3K4me3 immunoblot of N2, eat-2(ad1116), sams-1(ok2946), wdr-5(ok1417) and rbr-2(tm1231) worms. The whole-cell extracts of L4 worms were subjected to immunoblotting using anti-H3K4me3 or anti-H3 antibodies. WDR-5, a core subunit of the H3K4me3 methyltransferase complex, was included here as a positive control. RBR-2, a known H3K4me3 demethylase, was included here as a negative control. (b) ChIP-QPCR analysis of H3K4me3 level at hlh-30 promoter in N2, sams-1(ok2946) and set-2(bn129) at L4 larval stage. Primer pairs a and b recognized two different sites at hlh-30 promoter. IgG antibody was used as a negative control. An intergenic region at chromosome IV (ChrIV) was used as a control site. Mean SD of three independent experiments are shown. ***P < 0.001, One-Way ANOVA with Dunnett’s test relative to N2. (c) ChIP-QPCR analysis of HLH-30::GFP at hlh-30 promoter in WT, sams-1(ok2946) and set-2(bn129) worms expressing hlh-30p::hlh-30::gfp at L4 larval stage. N2 strain was used as a control strain. Mean
SD of three independent experiments are shown. *P < 0.05, ****P < 0.0001, One-Way ANOVA with Dunnett’s test relative to WT strain expressing hlh-30p::hlh-30::gfp. (d) ChIP-QPCR analysis of H3K4me3 level at pha-4 promoter in N2, sams-1(ok2946) and set-2(bn129) at L4 larval stage. Primer pairs a and b recognized two different sites at pha-4 promoter. IgG antibody was used as a negative control. An intergenic region at chromosome IV (ChrIV) was used as a control site. Mean
SD of three independent experiments are shown. ***P < 0.001, One-Way ANOVA with Dunnett’s test relative to N2. (e-f) ChIP-QPCR analyses of H3K4me3 level at hlh-30 promoter (E), or pha-4 promoter (F) in N2 and amx-1(ok659) at L4 larval stage. Mean
SD of three independent experiments are shown. ***P < 0.001, ****P < 0.0001, Student’s t-test.
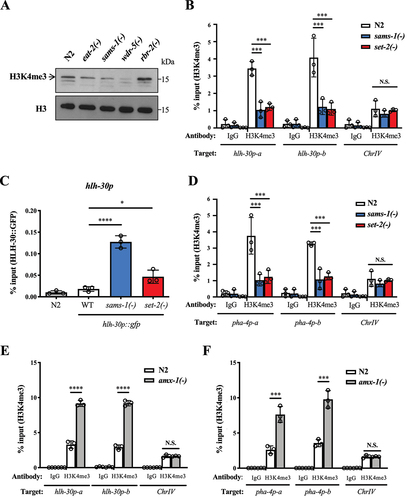
Figure 7. HLH-30/TFEB and PHA-4/FOXA collaboratively regulate autophagy and lifespan. (a-d) HLH-30 and PHA-4 ChIP-seq data of L4 worms expressing hlh-30::gfp and pha-4::gfp respectively were downloaded from modENCODE project (ftp://data.modencode.org/). (A) Graph shows enrichment of HLH-30 and PHA-4 at ±3 kb of transcription start sites (TSS) associated with 13,117 known genes across the genome. Data of two independent ChIP-seq experiments were shown. (b) Venn diagram shows the total number of HLH-30 and PHA-4 binding sites, and overlapped binding sites in L4 worms. 1475 overlapped binding sites were identified, which represented 38% of all PHA-4 binding sites and 51% of all HLH-30 binding sites. *P < 0.0001, Fisher’s exact test was used to test the significance of the overlaps. 886 genes were then identified to contain both HLH-30 and PHA-4 binding sites at their promoter regions. (c) Distribution of distances between HLH-30 and PHA-4 peak centers. HLH-30 peak center is denoted as 0 bp; negative and positive values indicate the distance of a PHA-4 peak center upstream and downstream of HLH-30 respectively on the genome. (d) Gene Ontology (GO) term enrichment analysis of the 886 common target genes whose promoter region contains both HLH-30 and PHA-4 binding sites. 10 GO terms with the lowest q values are shown. (e,f) ChIP-QPCR analyses of HLH-30::GFP (E), and PHA-4::GFP (F) at lgg-1 promoter in WT, sams-1(ok2946) and set-2(bn129) worms expressing hlh-30p::hlh-30::gfp and pha-4p::pha-4::gfp respectively at L4 larval stage. N2 strain was used as a control strain. An intergenic region at chromosome IV (ChrIV) was used as a control site. Mean SD of three independent experiments are shown. *P < 0.05, **P < 0.01, One-way ANOVA with Dunnett’s test relative to WT strain expressing hlh-30p::hlh-30::gfp or pha-4p::pha-4::gfp. (g,h) ChIP-QPCR analyses of HLH-30::GFP (G), and PHA-4::GFP (H) at lgg-1 and sodh-1 promoter in sams-1(ok2946) worms expressing hlh-30p::hlh-30::gfp fed with EV or pha-4 (G), hlh-30 (H) RNAi bacteria at L4 larval stage. An intergenic region at chromosome IV (ChrIV) was used as a control site. Mean
SD of three independent experiments are shown. N.S. no significance, Student’s t-test.
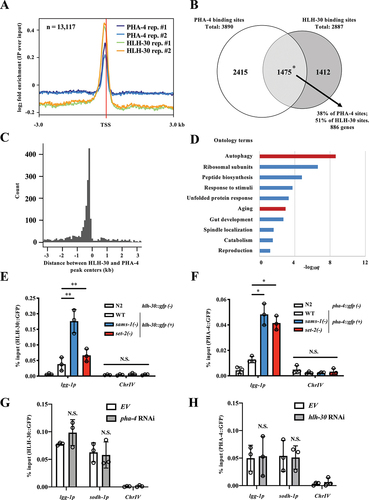
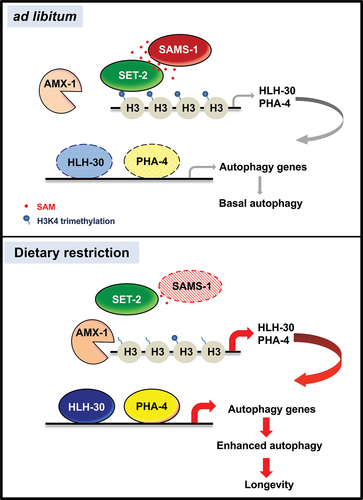
Figure 8. Model of autophagy and longevity through SAM-dependent methylation. Proposed model of dietary restriction-mediated longevity through SAMS-1/SET-2 axis, H3K4 methylation and HLH-30/PHA-4 module that collaboratively regulates expression of autophagy-related genes. Under ad libitum condition, SAMS-1 synthesis SAM, which serves as the substrate for histone H3K4 methylation by SET-2. There is a basal level of hlh-30 and pha-4 transcription that provides basal autophagy-related genes transcription. Under DR condition, sams-1 level reduces and thus there is less SAM for H3K4 methylation catalyzed by SET-2. The AMX-1 activity outweighs the SET-2 activity. Therefore, the hypomethylation of H3K4me3 at hlh-30 and pha-4 promoters enhances their transcription, which in turn leads to an increased transcription of autophagy-related genes to activate autophagy and increase longevity.