Figures & data
Figure 1. Autophagic activity is blocked in the skin and HF of C3H/HeJ AA mice. (A) Mouse images showing the extent of hair loss in grafted C3H/HeJ AA mice at 8 weeks after grafting. Solid black line demarcates the area of skin without hair shafts. (B) Western blot for LC3B and SQSTM1 on protein lysates prepared from sham and AA grafted skin. TUBB was used to normalize total amount of protein loaded per well. Graphs show the quantification of western blot band intensities and data pooled from 3 independent experiments with 4 mice per group. Unpaired two-tailed t-test was used to analyze data. ***p-values <0.005 was significant, ns = not significant. (C) Immunostaining and microscopic imaging of SQSTM1 protein expression in the HF of sham and AA grafted mice. The white dotted line outline the area encompassing the HF and excluding the region of sebaceous glands. The white asterisks mark autofluorescence from the hair shafts that were excluded from the measurement of SQSTM1 staining intensity. Graphs on the right show the quantification of data pooled from 3 independent experiments with SQSTM1 staining intensity measured in n = 35 HF from sham grafted and n = 40 HF from AA grafted mice imaged from 5 mice per group. Unpaired two-tailed t-test was used to analyze data. *p-values <0.05 was considered significant, ns = not significant. (D) Immunostaining and microscopic imaging of LC3B protein expression in the HF of sham and AA grafted mice. The white dotted line outlines the area encompassing the HF and excluding the region of sebaceous glands. The white asterisks mark autofluorescence from the hair shafts that were excluded from the measurement of LC3B staining intensity. Graphs on the right show the quantification of data pooled from 3 independent experiments with LC3B staining intensity measured in n = 20 HF from sham grafted and n = 35 HF from AA grafted mice imaged from 5 mice per group. Unpaired two-tailed t-test was used to analyze data. ns = not significant. (E) Western blot analysisof phosphorylated BECN1 (S91) and total BECN1 on the protein lysates prepared from sham and AA grafted skin. TUBB was used to normalize total amount of protein loaded per well. Graphs show the quantification of western blot band intensities and data pooled from 3 independent experiments with total 11 mice per group. Unpaired two-tailed t-test was used to analyze data. *p-values <0.05 was considered significant, ns = not significant. (F) Western blot analysis of LC3B and SQSTM1 expression in protein lysates isolated from the SDLN of sham and AA grafted mice. Graph shows quantification of band intensities with data pooled from 3 independent experiments with total 12 mice per group. Unpaired two-tailed t-test was used to analyze data. ns = not significant. (G) Western blot analysis of phosphorylated BECN1 (S91) and total BECN1 expression in protein lysates isolated from the SDLN cells of sham and AA grafted mice. Graph shows quantification of band intensities with data pooled from 3 independent experiments with total 12 mice per group. Unpaired two-tailed t-test was used to analyze data. ns = not significant.
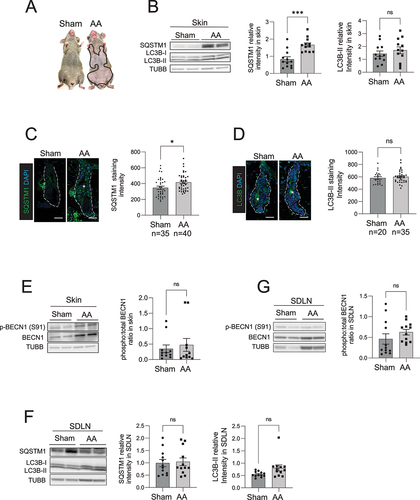
Figure 2. Induction of autophagy with Tat-BECN1 peptide delays onset of AA. (A) Mouse images showing the extent of hair loss in Tat-SCRAMBLE or Tat-BECN1 peptide treated AA mice at 5 weeks after peptide teratment. Solid black lines demarcate the area of skin without hair shafts. (B) Graph showing quantification of % area of skin exhibiting hair loss in Tat-SCRAMBLE or Tat-BECN1 peptide treated AA mice. Data were pooled from 2 independent experiments with at least 2 mice per group. Two-way ANOVA was used to analyze data. *p < 0.05 was considered significant. (C) Mouse images showing extent of hair loss in Tat-SCRAMBLE or Tat-BECN1 peptide treated AA mice at 2 weeks after peptide treatment discontinuation. Solid black lines demarcate the area of skin without hair shafts. (D) Graph shows the area under the curve (AUC) measurement for % area of skin showing hair loss upon Tat-SCRAMBLE or Tat-BECN1 treatment over weeks after grafting. Unpaired two-tailed t-test was used to analyze data. *p-values <0.05 was considered significant. (E) Graphs show the frequency of various T cells and macrophage subsets in the skin and skin-draining lymph nodes (SDLN) of Tat-SCRAMBLE or Tat-BECN1 treated AA mice. 5 mice were used per treatment group. Two-way ANOVA statistical test was performed and p < 0.05 were considered statistically significant. Differences between groups were not significant (ns).
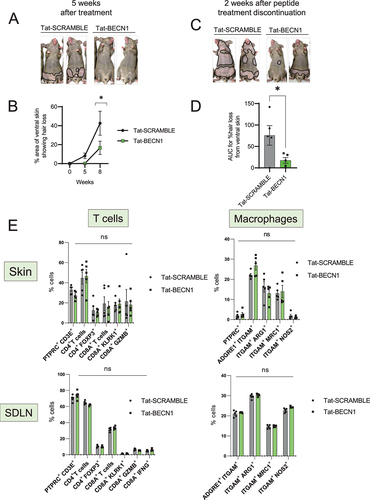
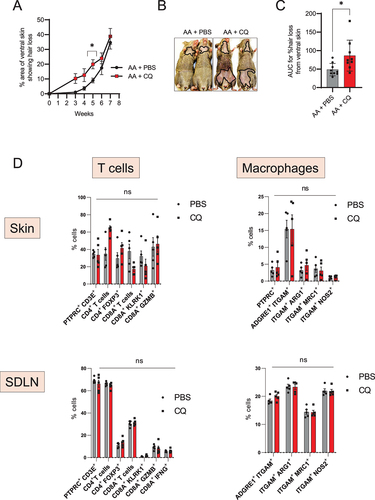
Figure 3. Autophagy blocker chloroquine accelerates disease onset in AA mice. (A) Graph shows the quantification of the % area of skin showing hair loss in CQ, or PBS treated AA mice. CQ treated mice had a significantly larger area of skin showing hair loss at 5 weeks after grafting. Data were pooled from 3 independent experiments with 3 mice per group. Two-way ANOVA was used to analyze data. *p < 0.05 was considered significant. (B) Images show the extent of disease in grafted AA mice upon treatment with CQ or PBS vehicle. Solid black line demarcates the area of skin without hair shafts. (C) Graph shows AUC measurement for % area of skin showing hair loss upon CQ or PBS treatment over weeks after grafting. Unpaired two-tailed t-test was used to analyze data. *p-values <0.05 was considered significant. (D) Graphs show the frequency of various T cells and macrophage subsets in the skin and skin-draining lymph nodes (SDLN) of PBS or CQ treated AA mice. 5 mice were used per treatment group. Two-way ANOVA statistical test was performed and p < 0.05 were considered statistically significant. Differences between groups were not-significant (ns).