
Figures & data
Figure 1. The zebrafish embryo model recapitulates susceptibilities of clinical IA. (a) Schematic representation of the zebrafish embryo – A. fumigatus infection model. Conidia of A. fumigatus D141 expressing an EGFP fluorescent plasmid were injected in the hindbrain at 32 hpf and representative images of infection at 2, 48 and 72 h post infection are shown. (B, C, D, and E) Survival curves of zebrafish embryos infected with A. fumigatus ∆Ku80 and exposed via waterborne treatment to 1 μM of cyclosporin A (b), 0.2 μM of FK506 (c), 0.5 μM of rapamycin (d), 15 μM of dexamethasone (e), or DMSO as a vehicle control at the same v/v. (f) Survival curves of cyba crispants or scramble control zebrafish embryos infected with A. fumigatus ∆Ku80. (g) Survival curves of zebrafish embryos with or without neutrophil ablation with metronidazole infected with A. fumigatus ∆Ku80. (b, d and f) are representative of at least 3 independent biological replicates, while (c) is representative of 2 independent biological replicates. The hazard ratio (HR) indicated is calculated vs. the control condition using the logrank method. Significance in the curve comparison is calculated using Log-rank (Mantel-Cox test): ns non-significant; * P ≤ 0.05; ** P ≤ 0.01; *** P ≤ 0.001; **** P ≤ 0.0001.
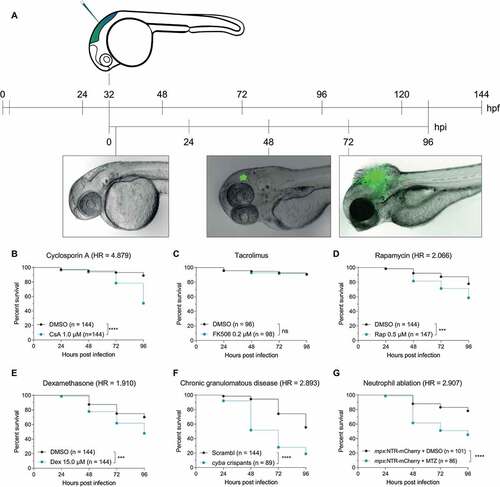
Figure 2. GFP-Lc3 dynamics in phagocytes after phagocytosing A. fumigatus conidia. (a) Representative sequence of events following injection of A. fumigatus conidia into the hindbrain of a zebrafish embryo. More than 100 A. fumigatus ∆Ku80 conidia are initially phagocytosed by the first 3 macrophages to arrive at the infection foci. Arrows indicate macrophage arrival and phagocytosis start. Images taken from Movie S1. (b and c) Confocal microscopy images showing the brightfield (b) or GFP-Lc3 fluorescence intensity (c) during the first 6 h and 30 min after infection. Most conidia are phagocytosed in the first 5 h post infection by a small number of phagocytes. Arrows indicate GFP-Lc3 levels in immune cells after phagocytosing A. fumigatus conidia, including individual GFP-Lc3 rings around the conidia. Images taken from Movie S2. (d and e) Brightfield (d) and GFP-Lc3 fluorescence intensity (e) of a macrophage with several conidia showing a GFP-Lc3 puncta. (f and g) Brightfield (f) and mCherry-Lc3 fluorescence intensity (g) confocal microscopy images showing mCherry-Lc3 accumulation across vesicles with individual and multiple spores. (h and i) Confocal images of GFP-Lc3 accumulation around germinating conidia of A. fumigatus D141 expressing dsRed fluorescent plasmid [Citation40] in the hindbrain of zebrafish embryos fixed 15 h post infection.
![Figure 2. GFP-Lc3 dynamics in phagocytes after phagocytosing A. fumigatus conidia. (a) Representative sequence of events following injection of A. fumigatus conidia into the hindbrain of a zebrafish embryo. More than 100 A. fumigatus ∆Ku80 conidia are initially phagocytosed by the first 3 macrophages to arrive at the infection foci. Arrows indicate macrophage arrival and phagocytosis start. Images taken from Movie S1. (b and c) Confocal microscopy images showing the brightfield (b) or GFP-Lc3 fluorescence intensity (c) during the first 6 h and 30 min after infection. Most conidia are phagocytosed in the first 5 h post infection by a small number of phagocytes. Arrows indicate GFP-Lc3 levels in immune cells after phagocytosing A. fumigatus conidia, including individual GFP-Lc3 rings around the conidia. Images taken from Movie S2. (d and e) Brightfield (d) and GFP-Lc3 fluorescence intensity (e) of a macrophage with several conidia showing a GFP-Lc3 puncta. (f and g) Brightfield (f) and mCherry-Lc3 fluorescence intensity (g) confocal microscopy images showing mCherry-Lc3 accumulation across vesicles with individual and multiple spores. (h and i) Confocal images of GFP-Lc3 accumulation around germinating conidia of A. fumigatus D141 expressing dsRed fluorescent plasmid [Citation40] in the hindbrain of zebrafish embryos fixed 15 h post infection.](/cms/asset/c31cc402-270a-4c9f-a3f8-35d0e2dfccef/kaup_a_2090727_f0002_oc.jpg)
Figure 3. Differential GFP-Lc3 dynamics in phagocytes after phagocytosing A. fumigatus conidia. (a, b, c, d, and e) Quantification of phagocytosis and Lc3 dynamics in 15 hours of timelapse imaging from 5 individual larvae infected with A. fumigatus ∆Ku80 conidia during the first hours post infection. (a) Most of the injected conidia in the zebrafish hindbrain are phagocytosed by macrophages, and (b) macrophages phagocytose more conidia per cell than neutrophils. (c, d, and e) In the events of conidial phagocytosis by neutrophils, we observed rapid bright Lc3 rings covering single-conidia vesicles, while Lc3 decoration of conidia-containing vesicles in macrophages was scarcer in the first hours post infection. (f) A non-labeled phagocyte (neutrophil, N) strongly mobilizes GFP-Lc3 to single conidia-containing vesicles shortly after phagocytosis (arrowheads), while labeled mCherryF-macrophages show high GFP-Lc3 fluorescence but not colocalizing with A. fumigatus ∆Ku80 conidia labeled with Alexa Fluor™ NHS 647 (Af647). Image taken from the Movie S3. (G, H, I, and J) Examples of GFP-Lc3 puncta (g), and GFP-Lc3 signal around single (h) or multiple conidia (h and i) in mCherryF labeled macrophages. Note that the membrane-bound mCherryF signal of macrophages colocalizes with GFP-Lc3 signal after conidia phagocytosis. Contrasting to the bright GFP-Lc3 signal in neutrophils (f), macrophages show weaker GFP-Lc3 targeting to phagocytosed conidia. (j) GFP-Lc3 targeting of single-conidia continues during the first hours after formation of a granuloma-like structure.
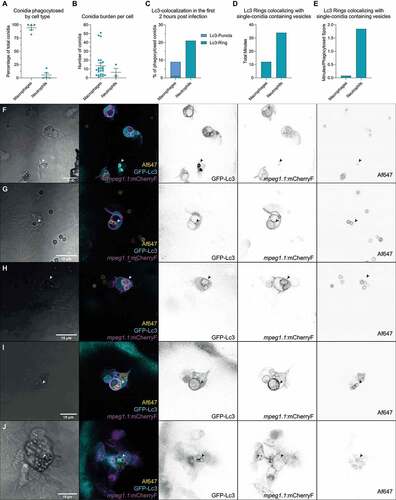
Figure 4. Suppression of autophagy pathways increases susceptibility to A. fumigatus infection. (a and b) Survival curves of atg13 mutation (a) or rubcn (b) knockdown or control zebrafish embryos infected with A. fumigatus ∆Ku80. (c) Survival curve of sqstm1 mutants or non-mutant siblings infected with A. fumigatus ∆Ku80. (d) Survival curve of zebrafish embryos infected with equal inoculum (150 conidia) of A. fumigatus ∆Ku80 or DHN-Melanin-deficient A. fumigatus ∆pksP. (e and f) Survival curves of atg13 mutation (e) or rubcn (f) knockdown or control zebrafish embryos infected with A. fumigatus ∆pksP. (G, H, I, J, and K) Quantification of phagocytosis and Lc3 dynamics in 21 hours of timelapse imaging from 5 individual larvae infected with A. fumigatus ∆pksP conidia labeled with Alexa Fluor™ NHS 647 during the first hours post infection. (g) Most of the injected conidia in the zebrafish hindbrain are phagocytosed by macrophages, and (h) macrophages phagocytose more conidia per cell than neutrophils. (i, j, and k) In the events of conidial phagocytosis by neutrophils, we observed rapid bright Lc3 rings covering single-conidia vesicles, while Lc3 decoration of conidia-containing vesicles in macrophages was scarcer and shorter in the first hours post infection. Examples of GFP-Lc3 signal around single A. fumigatus ∆pksP conidia labeled with Alexa Fluor™ NHS 647 (Af∆pksP) in mCherryF negative phagocytes (l, m), or mCherryF labeled macrophage (n). Images taken from Movie S4. All survival curves are representative of at least 3 independent biological replicates. The hazard ratio (HR) indicated is calculated vs. the control condition using the logrank method. Significance in the curve comparison is calculated using Log-rank (Mantel-Cox test): ns non-significant; * P ≤ 0.05; ** P ≤ 0.01; *** P ≤ 0.001; **** P ≤ 0.0001.
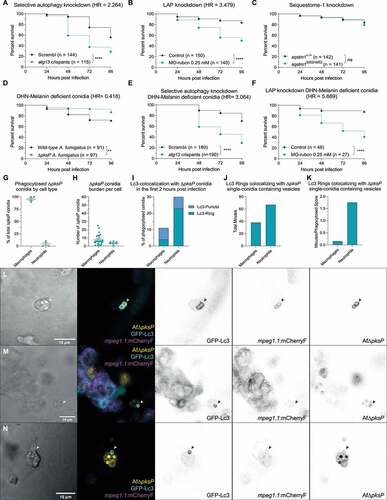
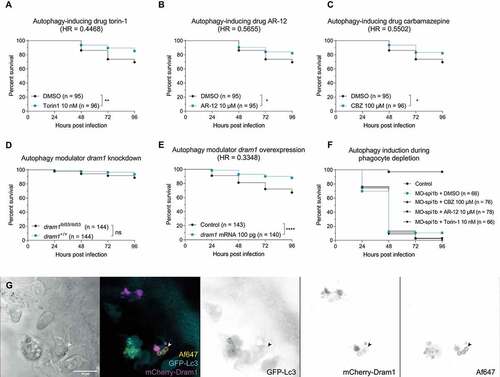
Figure 5. Stimulating the (auto)phagolysosomal axis increases the host survival against IA. (a, b and c) Survival curves of zebrafish embryos infected with A. fumigatus ∆Ku80 and exposed via waterborne treatment to 10 nM of torin 1 (a), 10 μM of AR-12 (b), 100 μM or carbamazepine (c), or DMSO as a vehicle control at the same v:v. (a, b, and c) infections were performed together but showed in split graphs for visualization purposes. (d) Survival curve of dram1 mutants or non-mutant siblings infected with A. fumigatus ∆Ku80. (e) Survival curve of zebrafish embryos overexpressing Dram1 after injection of 100 pg of dram1 mRNA or their control infected with A. fumigatus ∆Ku80. (e) Confocal image demonstrating colocalization (arrowheads) of mCherry-Dram1 with Alexa Fluor™ NHS 647-labeled A. fumigatus conidia (Af647) inside a phagocyte in the zebrafish hindbrain shortly after infection. All survival curves are representative of at least 3 independent biological replicates. The hazard ratio (HR) indicated is calculated vs. the control condition using the logrank method. Significance in the curve comparison is calculated using Log-rank (Mantel-Cox test): ns non-significant; * P ≤ 0.05; ** P ≤ 0.01; *** P ≤ 0.001; **** P ≤ 0.0001.
Supplemental Material
Download Zip (81.8 MB)Data availability statement
All images presented in this manuscript except are stills from confocal timelapse imaging experiments. All raw confocal imaging data is freely available for download and reuse via Biostudies under accession number S-BSST698 (https://www.ebi.ac.uk/biostudies/studies/S-BSST698), in which each file is tagged with the figures that belong to it.