Figures & data
Figure 1. Cladogram and nomenclature of ATG9 proteins. The phylogenetic cladogram from a multiple sequence alignment of ATG9 proteins across different species. The amino acid sequences (NCBI) from each species were aligned using the alignment software MUSCLE [Citation17], and the phylogenetic tree was created using the maximum likelihood method in MegaX [Citation18] and then verified with panther tree viewer on ALLIANCE genome resources [Citation19] and the ensembl gene tree [Citation20]. The gene and protein nomenclature of each homolog are indicated on the right side. Notably, two homologs (A/B) are expressed in mammals and zebrafish, while only one homolog exists in flies, worms, yeast, and Arabidopsis.
![Figure 1. Cladogram and nomenclature of ATG9 proteins. The phylogenetic cladogram from a multiple sequence alignment of ATG9 proteins across different species. The amino acid sequences (NCBI) from each species were aligned using the alignment software MUSCLE [Citation17], and the phylogenetic tree was created using the maximum likelihood method in MegaX [Citation18] and then verified with panther tree viewer on ALLIANCE genome resources [Citation19] and the ensembl gene tree [Citation20]. The gene and protein nomenclature of each homolog are indicated on the right side. Notably, two homologs (A/B) are expressed in mammals and zebrafish, while only one homolog exists in flies, worms, yeast, and Arabidopsis.](/cms/asset/0d20bd77-8bd2-47e7-a3d8-c7fd34ba6c0c/kaup_a_2384349_f0001_oc.jpg)
Figure 2. The structure of the human ATG9A. (A) left panel: the topology of the human ATG9A monomer (full length; 1–839 amino acids). The numbers in red indicate the corresponding amino acid residues of each alpha helix. Dark red regions show the two membrane-embedded helices that do not penetrate the membrane. Right panel: the 3D reconstruction from the AlphaFold prediction [Citation43] of human ATG9A (AF-Q7Z3C6-F1-model_v1). The structure is color-coded by the disordered score. (B) the structure of the human ATG9A trimer generated from the cryo-EM density map (EMDB: EMD-21876, PDB: 6WR4). Each monomer is colored differently, and gray disks outline the edges of the membrane. Note that this model does not represent the full-length protein, and shows residues 36 to 587, with missing loop residues 96–108 and 536–538, and includes two additional helices in the C-terminal domain among a total of 839 amino acids in a monomer. The arrows show the locations of the three different types of pores. The structural images were generated and modified using the RCSB PDB webserver (https://www.rcsb.org) [Citation44] and 3D viewers Mol* viewer [Citation45], respectively.
![Figure 2. The structure of the human ATG9A. (A) left panel: the topology of the human ATG9A monomer (full length; 1–839 amino acids). The numbers in red indicate the corresponding amino acid residues of each alpha helix. Dark red regions show the two membrane-embedded helices that do not penetrate the membrane. Right panel: the 3D reconstruction from the AlphaFold prediction [Citation43] of human ATG9A (AF-Q7Z3C6-F1-model_v1). The structure is color-coded by the disordered score. (B) the structure of the human ATG9A trimer generated from the cryo-EM density map (EMDB: EMD-21876, PDB: 6WR4). Each monomer is colored differently, and gray disks outline the edges of the membrane. Note that this model does not represent the full-length protein, and shows residues 36 to 587, with missing loop residues 96–108 and 536–538, and includes two additional helices in the C-terminal domain among a total of 839 amino acids in a monomer. The arrows show the locations of the three different types of pores. The structural images were generated and modified using the RCSB PDB webserver (https://www.rcsb.org) [Citation44] and 3D viewers Mol* viewer [Citation45], respectively.](/cms/asset/46e7ee33-1b12-4068-826a-9d19ef162133/kaup_a_2384349_f0002_oc.jpg)
Figure 3. ATG9/ATG9A trafficking in nonneuronal cells and working models for phagophore growth. Upper panel: trafficking of ATG9/ATG9A in nonneuronal cells and its involvement in the autophagic process. Proteins shown in purple are potential ATG9/ATG9A interactors according to previous proteomic studies. Lower panel: proposed models for ATG9/ATG9A-mediated phagophore growth and the remaining questions.
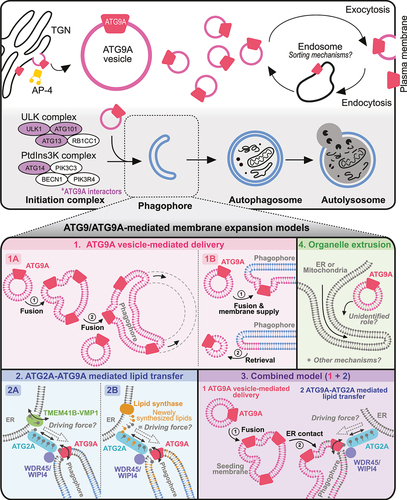
Figure 4. Trafficking and function of ATG9/ATG9A in neurons. ATG9/ATG9A is believed to be transported to nerve terminals, undergo activity-dependent exo- and endocytosis, and localize to distinct vesicle pools at presynapses. However, the details of its precise roles in nerve terminals remain unclear. Potential ATG9A interactors based on proteomic analyses are shown in purple. The asterisk (*) indicates evidence from worms (C. elegans).
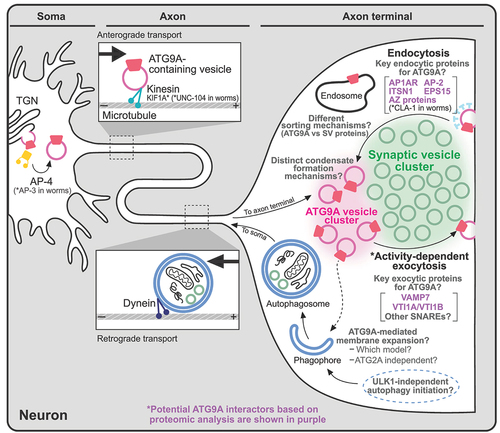
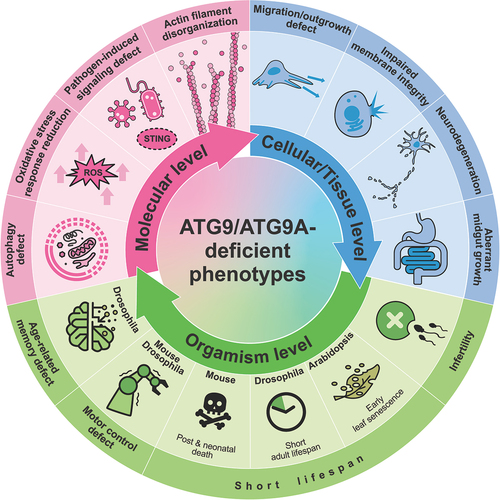
Figure 5. ATG9/ATG9A-deficient phenotypes. Loss of ATG9/ATG9A leads to various defects at different levels.