
Figures & data
Figure 1. Presentation of the tailored JD-R model that will be tested quantitatively (Aim 1) and qualitatively (Aim 2). Note. Descriptions of constructs are presented in .
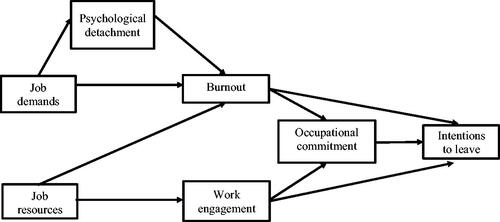
Table 1. Description of measures.
Table 2. Sociodemographic characteristics of the study sample.
Figure 2. Visual representation of the SEM model testing the tailored JD-R theoretical model and the relationships between the constructs. Note. The dotted constructs indicate the latent variables job demands and resource.
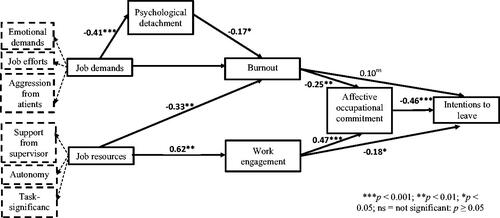
Table 3. Regression coefficients and test statistics for the relationships between the constructs used in the structural equation modeling.
Supplemental material