
Figures & data
Figure 1. Case selection flow diagram.
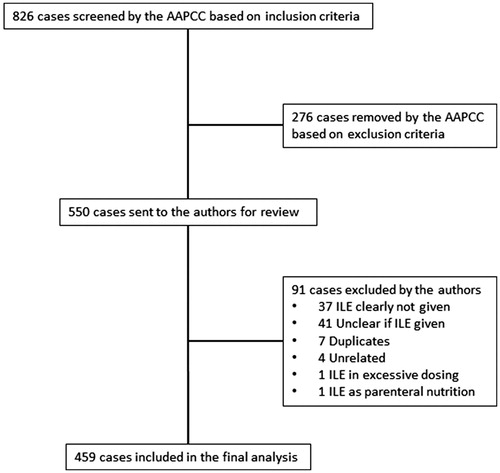
Figure 2. Annual trends in intravenous lipid emulsion use in cases of fatal poisoning. The graph demonstrates the number RCF category 1 or 2 fatal cases in which intravenous lipid emulsion therapy was used, represented as a percentage of all RCF category 1 or 2 cases in that year.
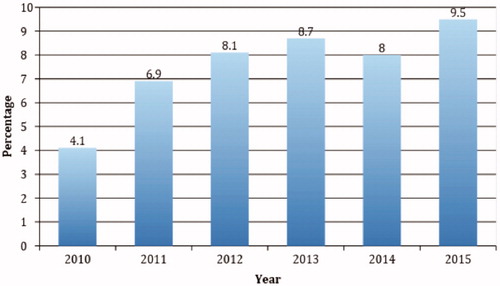
Figure 3. Timing of intravenous lipid emulsion administration. Some cases have more than one timing situation because of multiple administrations of intravenous lipid emulsion.
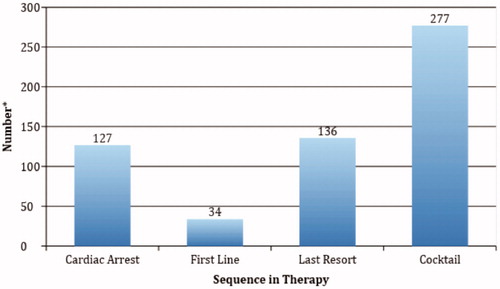
Table 1. List of the most common substances involved in the exposure.
Table 2. Detailed information on the use of intravenous lipid emulsion (ILE) for patients with local anesthetic systemic toxicity (LAST).Table Footnotea