
Figures & data
Figure 1. Examples of modern day food preparation practices on the Marshall Islands. Ebon villagers husking a coconut (A) and grating giant swamp taro (iaraj, Cyrtosperma merkusii) (B) (images by M. Weisler, with permission).
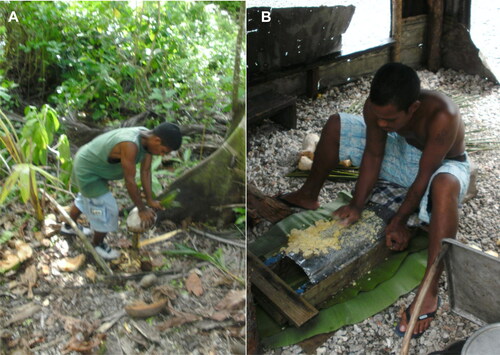
Figure 2. Map of Ebon Atoll showing the location of MLEb-5 archaeological site (modified from Harris and Weisler Citation2018, 43, reprinted with permission from Taylor & Francis).
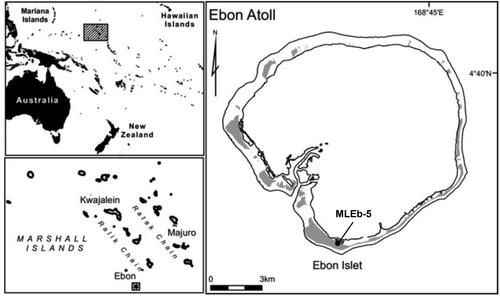
Figure 3. Bone fragments examined in the present case study. The red dashed lines indicate sampling regions for histology, with the extracted samples shown on the right (femur, radius) and left (right distal humerus). RT: radial tuberosity, DT: deltoid tuberosity, LA: linea aspera. Muscle insertions and origin are italicized.
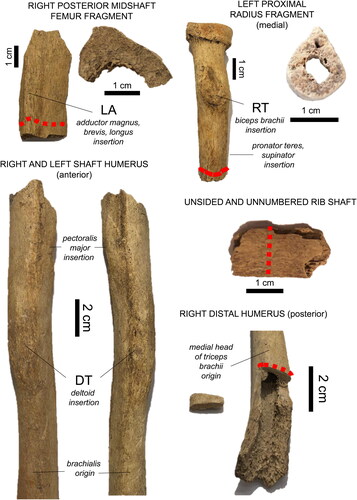
Figure 4. A summary of histological procedures (A and B) and results (C) of the present study. Examples of bone cross-sections are shown for the rib under normal transmitted light (A) and the radius under linearly polarized light (LPL) (B). The cross-section marked with red dots (A) indicates Haversian canals counted from the entirety of the cortical surface for the purpose of density calculations. The radius cross-section (B) shows a grid applied in ImageJ® v. 1.52 from which H.Ar regions of interest were identified. The magnified images (A1 and B1) show Haversian canals (white arrows, scale bars = 50 μm), viewed under LPL. The simple bar chart in C visually illustrates that the radius and humerus samples had higher canal densities of lower areas compared to the femur. The rib, as predicted, had the highest densities and smallest canal areas.
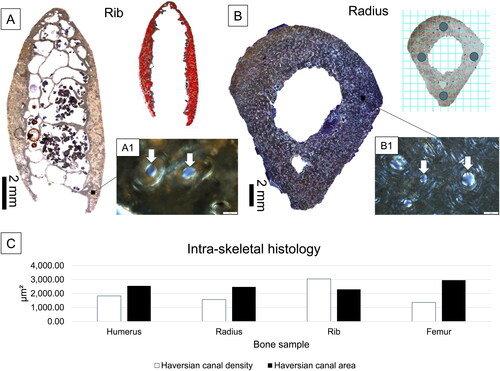
Table 1. Bone shaft measures of size in the middle-aged male from the Marshall Islands. Left humerus was not included in the histological analysis and is only presented here for illustrative purposes.
Table 2. Descriptive data for the measurements of Haversian canal area (H.Ar) in μm2 compared between cortical samples from different bones.