Figures & data
Table 1. Vulnerability index methodology: parameters, associated classes and weights
Table 2. Analytical Hierarchy Process for the risk index evaluation. Additional notes to perform comparisons at the macroscale and microscale levels are provided
Figure 1. Identification of the study area.
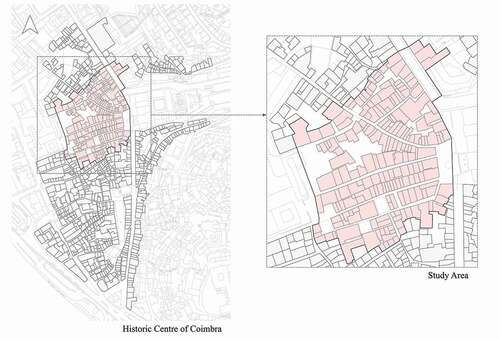
Figure 2. Case study HBE layout: building vulnerability and position of gathering areas (in green, including identification code).
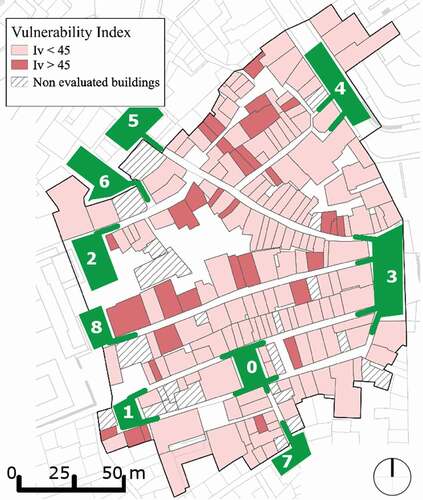
Table 3. Simulation results for the considered risk indicators, in the different tested scenarios s, and by considering the microscale assessment for each gathering area and the macroscale assessment. “-“ means that the gathering area has been removed from the evacuation plan. *: the ga is merged in s3 and s4; **: the ga in s3 and s4;is placed nearby the one in s1 and s2.
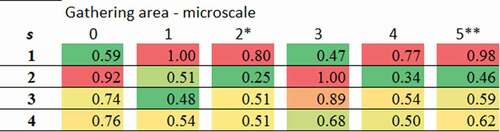
Table 4. Simulation results for the considered normalised risk indicators, in the different tested scenarios s, and by considering the microscale assessment for each gathering area and the macroscale assessment. “-“ means that the gathering area has been removed from the evacuation plan. *: the ga is merged in s3 and s4; **: the ga in s3 and s4;is placed nearby the one in s1 and s2.
Figure 3. Evacuation curves for the considered scenarios: the worst scenario in terms of Ntot is shown in red, while the best is represented in green.
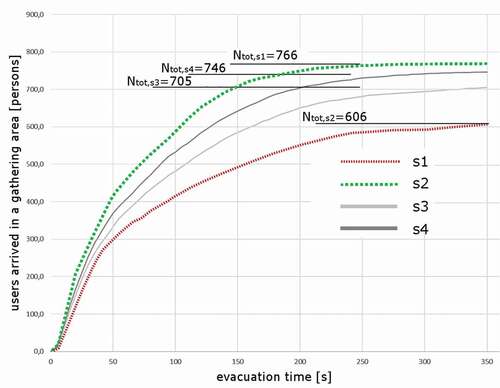
Figure 4. Oss usage for gathering purposes according to the original evacuation plan, for: (a) s1; (b) s2. Gathering areas (and their accesses) are highlighted in green when Nga,perc≥10% and in yellow when Nga,perc<10%. “Spontaneous” gathering areas are shown: in blue, for those placed along the streets; in violet, for those placed at the crossroads.
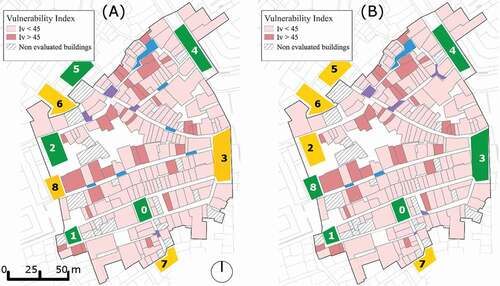
Figure 5. Streets debris evaluation for the current building vulnerability, by showing streets with >50% (red) and <50% (yellow) of the area occupied by debris. Streets blockage positions induced by debris are also shown by “X”. All the gathering areas are marginally occupied by debris (<10%).
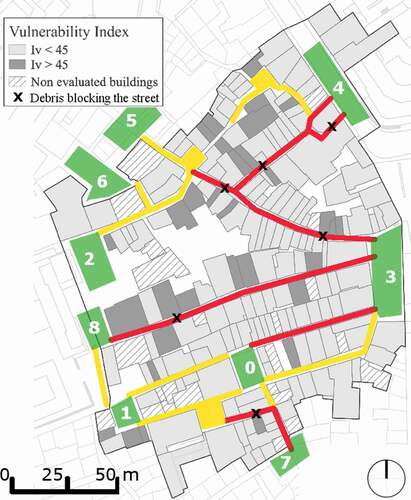
Figure 6. Improvement of the wall-to-wall connections using steel tie rods. Adapted from (Tiago Miguel Ferreira, Maio, and Vicente Citation2017).
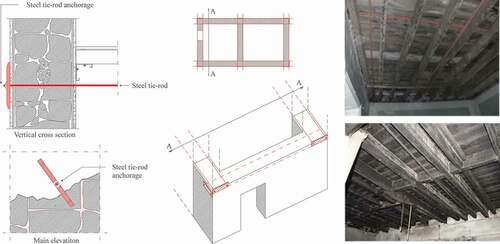
Figure 7. Improvement of the wall-to-floor connections through steel angle brackets. Adapted from (Tiago Miguel Ferreira, Maio, and Vicente Citation2017).
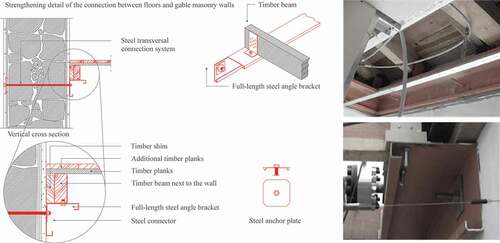
Figure 8. Improvement of the wall-to-roof connections using steel tie rods. Adapted from (Tiago Miguel Ferreira, Maio, and Vicente Citation2017).
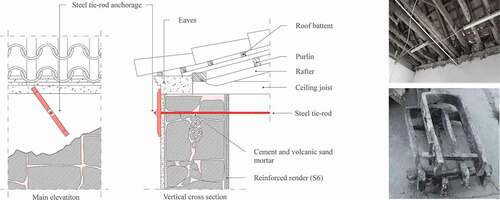
Figure 9. Revised evacuation plan: new position of gathering areas (and their accesses) according to s1 and s2 outcomes. Building to be retrofitted in s4 are also shown.
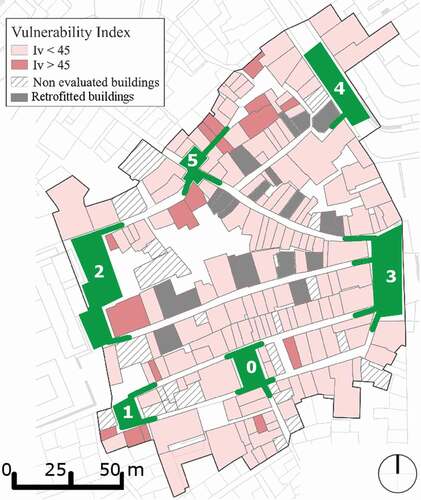
Figure 10. Oss usage for gathering purposes according to the revised evacuation plan as in , for: A- s3 and B- s4. “Spontaneous” gathering areas are shown in blue and identified by: *, for areas similar to s1 and s2; +, for those placed near to a deleted gathering area; !, for close to a new gathering area.
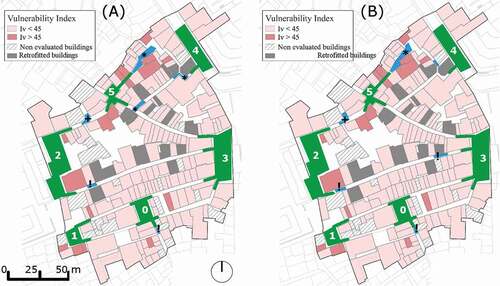
Figure 11. Summary of RI results at the microscale and macroscale, by stressing, on the bottom, the correlation between RI and Ntot,perc in the four scenarios.
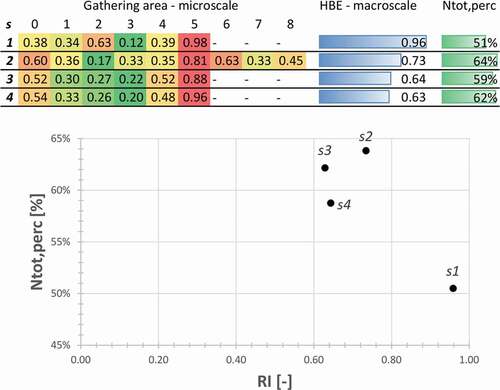
Figure 12. Summary of RI results at the microscale and macroscale, by stressing, on the bottom, the correlation between RI and Ntot,perc in the four scenarios. *: the ga is merged in s3 and s4; **: the ga in s3 and s4; is placed nearby the one in s1 and s2.