Figures & data
Figure 1. The monolithic churches at Lalibela (Ethiopia) that are the focus of this study: (a) Bete Amanuel (sheltered) and (b) Bete Giyorgis (unsheltered).
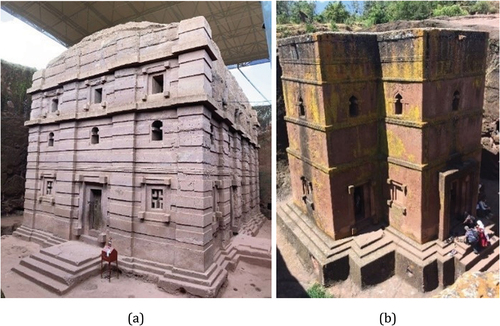
Table 1. Physical properties of samples used for gravimetric analysis in comparison with data from the churches bete amanuel and bete giyorgis.
Figure 2. Gravimetric analysis regression models of the saturation range (saturated to oven dry) in ambient drying conditions for the surface (red) and subsurface (black) sensors. The vertical bars represent the standard deviation from the mean of the measurements taken at a range of saturation (%).
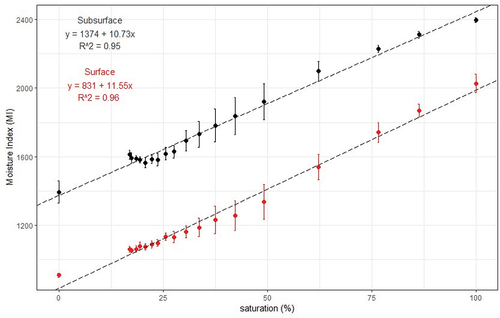
Figure 3. Orthophotos (@Archeovision 2019) of facades of (a) Bete Amanuel (BA14) and (b) Bete Giyorgis (BG1-4) showing zones where measurements were taken. Areas shaded in red and purple are indicating weathered and restored areas, respectively. A close up of areas in the blue squares are presented in
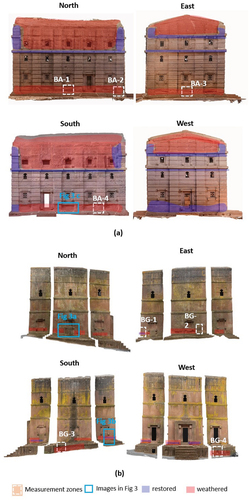
Figure 4. Images of Bete Giyorgis showing (a) coving and (b) restored area with salt efflorescence and images of Bete Amanuel (c) showing moisture-related damage and (d) granular disintegration and scaling. Note the scale in the images is 50 cm.
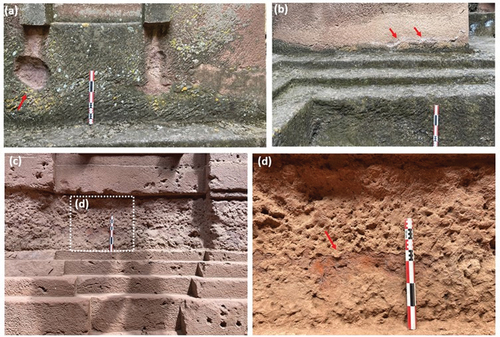
Figure 5. Percentage increase (% increase) in moisture content on the surface and subsurface of the zones measured at Bete Giyorgis (BG) and Bete Amanuel (BA). The error bars show that there is significant spatial variation in moisture across the measured areas (both at depth and on the surface) between dry and wet seasons.
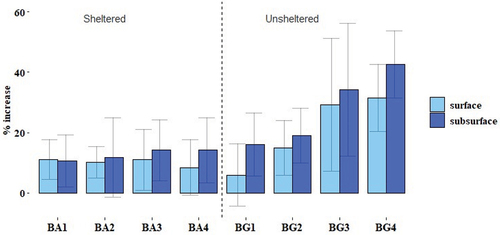
Figure 6. An image of the measured zone and the surface and subsurface spatial distribution of saturation (%) are shown: (a) BG1, (b) BG4, (c) BA1 and (d) BA4. The axes on the heatmaps show the height and width (cm) of the measured areas.
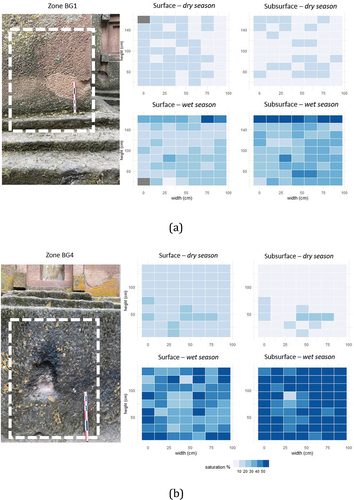
Figure 6. (Continued).
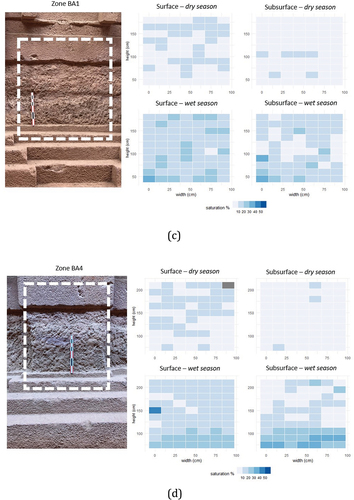
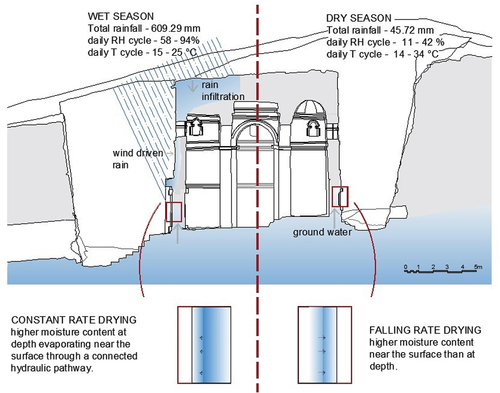
Figure 7. Conceptual diagram of moisture transport and dynamics at rock-cut monolithic structures during wet and dry seasons.