4,214
Views
99
CrossRef citations to date
0
Altmetric
Research Paper

HDAC inhibition attenuates cardiac hypertrophy by acetylation and deacetylation of target genes

, , , , , & show all
Pages 418-430 | Received 09 Jan 2015, Accepted 24 Feb 2015, Published online: 05 May 2015

Figures & data

Figure 1. HDAC inhibition with TSA prevents pathological cardiac remodeling and dysfunction. (A) Representative hearts of mice that underwent sham or TAC surgery, followed by injection with TSA (0.6 mg/kg/day) twice daily for 4 weeks. Scale bar = 5mm. (B) Graphs of left ventricular weight/ tibial length ratio (LV/TL). Data are expressed as means ± SEM; * P < 0.05 vs. sham with the same treatment; # P < 0.05; n = 9–10/ group. (C) Representative M-mode echocardiograms from sham and TAC mice with vehicle or TSA. Yellow arrows indicate differences in LV chamber dimensions. (D) Quantification of left ventricular end diastolic dimension (LVEDD). (E) Fractional shortening (FS) of sham and TAC mice with vehicle or TSA treatment. Data are expressed as means ± SEM; * P < 0.05 vs sham; # P < 0.05; n = 9-10/ group.
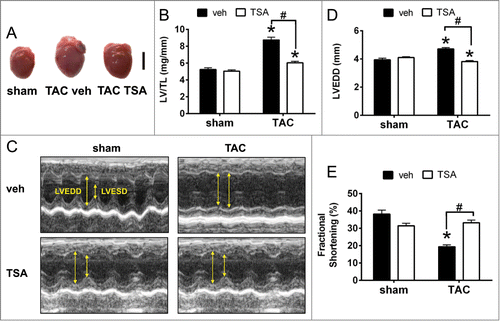
Figure 1. HDAC inhibition with TSA prevents pathological cardiac remodeling and dysfunction. (A) Representative hearts of mice that underwent sham or TAC surgery, followed by injection with TSA (0.6 mg/kg/day) twice daily for 4 weeks. Scale bar = 5mm. (B) Graphs of left ventricular weight/ tibial length ratio (LV/TL). Data are expressed as means ± SEM; * P < 0.05 vs. sham with the same treatment; # P < 0.05; n = 9–10/ group. (C) Representative M-mode echocardiograms from sham and TAC mice with vehicle or TSA. Yellow arrows indicate differences in LV chamber dimensions. (D) Quantification of left ventricular end diastolic dimension (LVEDD). (E) Fractional shortening (FS) of sham and TAC mice with vehicle or TSA treatment. Data are expressed as means ± SEM; * P < 0.05 vs sham; # P < 0.05; n = 9-10/ group.

Figure 2. Dynamic H3K9/K14 acetylation and deacetylation in the heart. (A) Genome-wide changes of TAC and TSA were investigated using H3K9/K14ac ChIP coupled with massive parallel sequencing (ChIP-seq). The targets identified from ChIP-seq were validated with ChIP-qPCR. Expression of corresponding genes was validated by qPCR. (B) H3K9/K14ac ChIP-seq profiles on the transcription start sites of promoters are shown. (C-F) MACS peak calling was used to identify differential H3K9/K14ac in response to TAC (comparison between TAC veh and sham veh) and TSA (TAC TSA vs. TAC veh). (C) Ideogram showing differential H3K9/K14ac regions on mouse (mm9) genome of TAC and (D) TSA group. (E) Genome-wide distribution of H3K9/K14 acetylation and deacetylation for TAC and (F) TSA shown by genomic feature using Fisher's exact test, represented as the log2 odds ratio. Error bars represent 95% confidence intervals. Feature annotation is described in the methods.
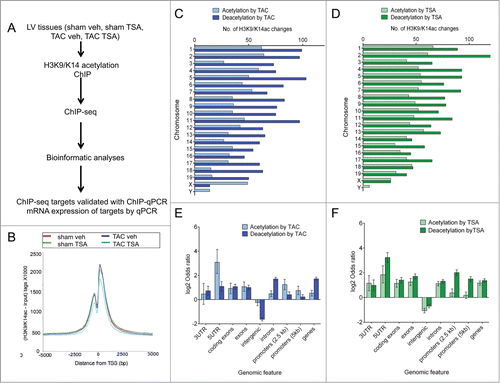
Figure 2. Dynamic H3K9/K14 acetylation and deacetylation in the heart. (A) Genome-wide changes of TAC and TSA were investigated using H3K9/K14ac ChIP coupled with massive parallel sequencing (ChIP-seq). The targets identified from ChIP-seq were validated with ChIP-qPCR. Expression of corresponding genes was validated by qPCR. (B) H3K9/K14ac ChIP-seq profiles on the transcription start sites of promoters are shown. (C-F) MACS peak calling was used to identify differential H3K9/K14ac in response to TAC (comparison between TAC veh and sham veh) and TSA (TAC TSA vs. TAC veh). (C) Ideogram showing differential H3K9/K14ac regions on mouse (mm9) genome of TAC and (D) TSA group. (E) Genome-wide distribution of H3K9/K14 acetylation and deacetylation for TAC and (F) TSA shown by genomic feature using Fisher's exact test, represented as the log2 odds ratio. Error bars represent 95% confidence intervals. Feature annotation is described in the methods.

Figure 3. HDAC inhibition with TSA reverses pressure overload-induced changes in histone acetylation and deacetylation. Three comparisons are investigated: 1) TAC (TAC veh vs. sham veh), 2) TSA (TAC TSA vs. TAC veh), and 3) sham controls (sham TSA vs. sham veh) (A) MA plots are shown to visualize the concentration of read counts for differential H3K9/K14ac changes in TAC, TSA and sham controls. The log2 (base mean) is a measure of the mean read concentration for each gene. (B) Heat map showing inverse fold changes in H3K9/K14ac between TAC and TSA. Red indicates increases in histone acetylation and green corresponding decreases in histone acetylation (C) Correlation of fold changes between TSA with TAC as well as (D) TSA with sham controls. Correlation was determined using Pearson's correlation (r). Red line represents the linear model. Only promoter (±2.5 kb from TSS) specific changes in H3K9/K14ac are shown for all plots.
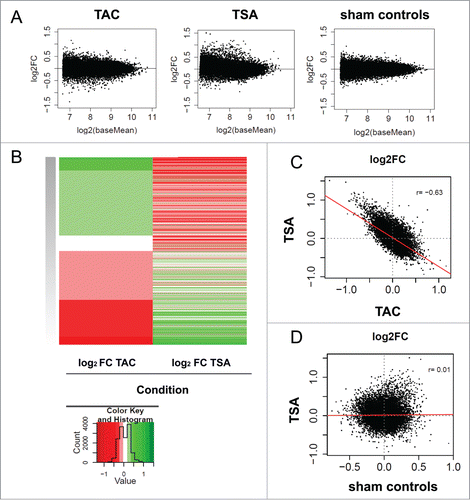
Figure 3. HDAC inhibition with TSA reverses pressure overload-induced changes in histone acetylation and deacetylation. Three comparisons are investigated: 1) TAC (TAC veh vs. sham veh), 2) TSA (TAC TSA vs. TAC veh), and 3) sham controls (sham TSA vs. sham veh) (A) MA plots are shown to visualize the concentration of read counts for differential H3K9/K14ac changes in TAC, TSA and sham controls. The log2 (base mean) is a measure of the mean read concentration for each gene. (B) Heat map showing inverse fold changes in H3K9/K14ac between TAC and TSA. Red indicates increases in histone acetylation and green corresponding decreases in histone acetylation (C) Correlation of fold changes between TSA with TAC as well as (D) TSA with sham controls. Correlation was determined using Pearson's correlation (r). Red line represents the linear model. Only promoter (±2.5 kb from TSS) specific changes in H3K9/K14ac are shown for all plots.

Figure 4. HDAC inhibition with TSA prevents histone acetylation of NFκB target genes. Two comparisons were investigated TAC (TAC veh vs. sham veh) and TSA (differences between TAC TSA and TAC veh). (A) Bar plot of number of GSEA pathways identified with histone acetylation and deacetylation changes for each condition. (B) Venn diagram showing the overlap for GSEA pathways between TAC and TSA. All gene sets are FDR q val < 0.05 according to standard GSEA output. (C) GSEA was used to identify H3K9/K14ac at promoters associated with transcription factor binding using the ENCODE ChIP-seq collection of transcription and co-regulatory factors and chromatin-associated proteins (TFBS). Bar plot of the top 10 TFBS gene sets by deacetylation with TSA and its corresponding association in response to TAC. Numbers following the protein name represent the cell line and have been defined in the methods. Gene sets for TSA are FDR q val < 0.05 according to standard GSEA output. A negative normalized enrichment score (NES) shows deacetylated gene sets, while a positive NES score indicates gene sets associated with histone acetylation. (D) GSEA plot showing an association of NFκB bound genes associated with histone acetylation in response to TAC and corresponding deacetylation with HDAC inhibitor TSA. Genes are ranked by changes in H3K9/K14ac.
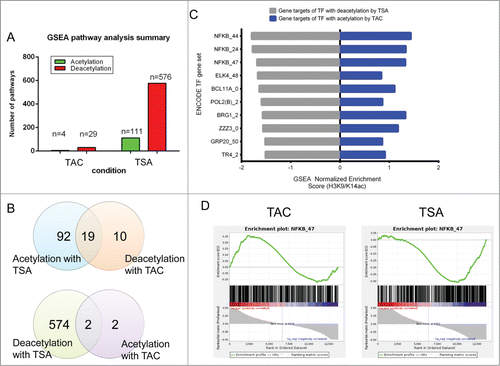
Figure 4. HDAC inhibition with TSA prevents histone acetylation of NFκB target genes. Two comparisons were investigated TAC (TAC veh vs. sham veh) and TSA (differences between TAC TSA and TAC veh). (A) Bar plot of number of GSEA pathways identified with histone acetylation and deacetylation changes for each condition. (B) Venn diagram showing the overlap for GSEA pathways between TAC and TSA. All gene sets are FDR q val < 0.05 according to standard GSEA output. (C) GSEA was used to identify H3K9/K14ac at promoters associated with transcription factor binding using the ENCODE ChIP-seq collection of transcription and co-regulatory factors and chromatin-associated proteins (TFBS). Bar plot of the top 10 TFBS gene sets by deacetylation with TSA and its corresponding association in response to TAC. Numbers following the protein name represent the cell line and have been defined in the methods. Gene sets for TSA are FDR q val < 0.05 according to standard GSEA output. A negative normalized enrichment score (NES) shows deacetylated gene sets, while a positive NES score indicates gene sets associated with histone acetylation. (D) GSEA plot showing an association of NFκB bound genes associated with histone acetylation in response to TAC and corresponding deacetylation with HDAC inhibitor TSA. Genes are ranked by changes in H3K9/K14ac.

Figure 5. TAC confers histone acetylation and HDAC inhibition attenuates the increase in histone acetylation and gene expression on NFκB target genes. (A) Increased promoter acetylation of Icam1, Cxcl10, and Il6r genes (blue line, blue arrow) are attenuated by HDAC inhibition with TSA (red line, red arrow). (B) Chromatin immunopurification of acetylated H3K9/K14 histones in the LV tissues assessed by real time qPCR on NFκB target genes. N = 4–7/group, TAC veh vs. sham veh: * P < 0.05; ** P < 0.01, *** P < 0.001; TAC TSA vs. TAC veh: # P < 0.05; ## P < 0.01; ### P < 0.001. (C) Gene expression changes were validated using qPCR of NFKB target genes. n = 4-5/group, TAC veh vs. sham veh: * P < 0.05, ** P < 0.01; *** P < 0.001; TAC TSA vs. TAC veh: # P < 0.05; ## P < 0.01; ### P < 0.001. Cxcl10, chemokine (C-X-C Motif) ligand 10; Il6ra, interleukin-6 receptor; Il21r, interleukin-21 receptor; Icam1, intercellular adhesion molecule-1; Ticam2, toll-like receptor adaptor molecule 2; Traf3, TNF receptor-associated factor 3; Vcam1, vascular cell adhesion molecule 1.
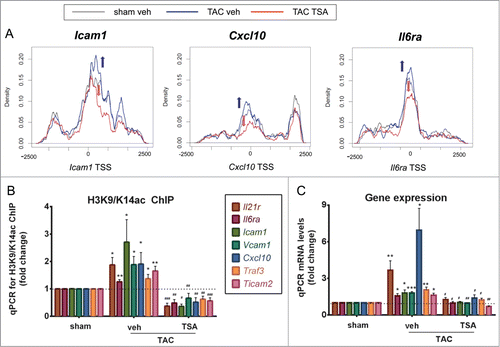
Figure 5. TAC confers histone acetylation and HDAC inhibition attenuates the increase in histone acetylation and gene expression on NFκB target genes. (A) Increased promoter acetylation of Icam1, Cxcl10, and Il6r genes (blue line, blue arrow) are attenuated by HDAC inhibition with TSA (red line, red arrow). (B) Chromatin immunopurification of acetylated H3K9/K14 histones in the LV tissues assessed by real time qPCR on NFκB target genes. N = 4–7/group, TAC veh vs. sham veh: * P < 0.05; ** P < 0.01, *** P < 0.001; TAC TSA vs. TAC veh: # P < 0.05; ## P < 0.01; ### P < 0.001. (C) Gene expression changes were validated using qPCR of NFKB target genes. n = 4-5/group, TAC veh vs. sham veh: * P < 0.05, ** P < 0.01; *** P < 0.001; TAC TSA vs. TAC veh: # P < 0.05; ## P < 0.01; ### P < 0.001. Cxcl10, chemokine (C-X-C Motif) ligand 10; Il6ra, interleukin-6 receptor; Il21r, interleukin-21 receptor; Icam1, intercellular adhesion molecule-1; Ticam2, toll-like receptor adaptor molecule 2; Traf3, TNF receptor-associated factor 3; Vcam1, vascular cell adhesion molecule 1.
Supplemental material

Supplemental_Material.zip

Download Zip (1.6 MB)

Reprints and Corporate Permissions

Please note: Selecting permissions does not provide access to the full text of the article, please see our help page How do I view content?

To request a reprint or corporate permissions for this article, please click on the relevant link below:

Academic Permissions

Please note: Selecting permissions does not provide access to the full text of the article, please see our help page How do I view content?

Obtain permissions instantly via Rightslink by clicking on the button below:

If you are unable to obtain permissions via Rightslink, please complete and submit this Permissions form. For more information, please visit our Permissions help page.