Figures & data
Figure 1. Relative changes in LINE-1 methylation levels in blood samples of balb/c mice treated with guadecitabine. Two months old female female Balb/c nude mice (BALB/cOlaHsd-Foxn1nu)balb/c Huh-7 tumor-bearing mice were injected s.c. with 2 mg/kg of guadecitabine and LINE-1 demethylation levels in whole blood [calculated as (methylation levels at day x – methylation levels at day 0)/(methylation levels day 0 *100)] were assessed at 9 and at 16 d post guadecitabine administration. Results for individual mice are shown. Six out of 8 mice (75%) show a distinct relative LINE-1 demethylation.
![Figure 1. Relative changes in LINE-1 methylation levels in blood samples of balb/c mice treated with guadecitabine. Two months old female female Balb/c nude mice (BALB/cOlaHsd-Foxn1nu)balb/c Huh-7 tumor-bearing mice were injected s.c. with 2 mg/kg of guadecitabine and LINE-1 demethylation levels in whole blood [calculated as (methylation levels at day x – methylation levels at day 0)/(methylation levels day 0 *100)] were assessed at 9 and at 16 d post guadecitabine administration. Results for individual mice are shown. Six out of 8 mice (75%) show a distinct relative LINE-1 demethylation.](/cms/asset/f4913848-a30e-47e7-b320-2a498b43fdc8/kepi_a_1214781_f0001_oc.gif)
Figure 2. Guadecitabine (Guad) prevents tumor growth in a HepG2 xenograft model. A. Pictures of explanted HepG2 tumors from PBS- and guadecitabine-injected immunocompromised mice, next to a ruler. B. Tumor growth in balb/c mice inoculated with HepG2 cells. The control group (n = 14) was injected with PBS while the experimental group (n = 14) was injected daily with 2 mg/kg guadecitabine from day 1 to 3 post-inoculation. Animals were sacrificed after 38 d, tumors were excised, and tumor, and volume/weight were assessed by means of a caliper and a precision scale, respectively. C. Tumors as in A-B were processed for H&E staining or for immunofluorescence with antibody against IsolectinB4 (IB4). For IF staining, nuclei were counterstained with DAPI.
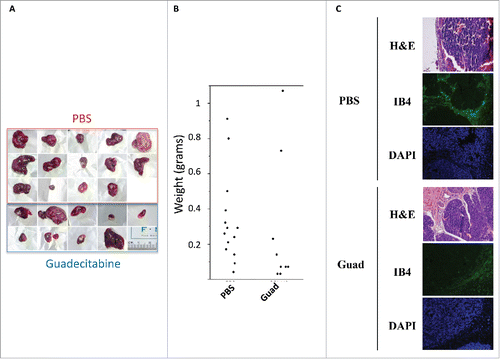
Figure 3. Guadecitabine (Guad) treatment does not influence liver fibrosis and preneoplastic foci formation in a NASH mouse model (STAM). The experimental group of mice was injected at week 8 with 2 mg/kg guadecitabine and sacrificed at week 10. A. Mice body weights were assessed daily after initial guadecitabine injection. B and C. ALT and AST transaminases levels (U/L) measured in mice sera upon sacrifice. D. Plasma triglycerides (mg/dL) measured in mice sera upon sacrifice. E. Immunohistochemical staining for αSMA in the livers of control vehicle-injected STAM mice (upper panel) or guadecitabine injected (lower panel). F. Immunohistochemical staining for glutamine synthetase (GS) in the livers of control vehicle-injected STAM mice (upper panel) or guadecitabine injected (lower panel). n = 9 for untreated STAM mice; n = 8 for guadecitabine-injected animals. Differences were not statistically significant (ns).
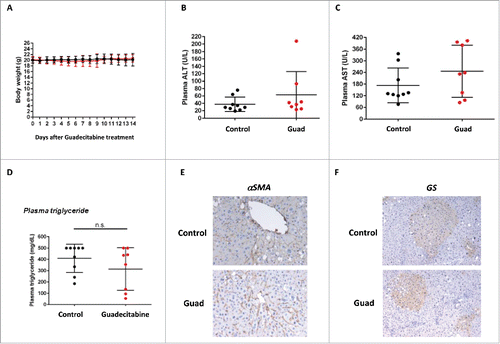
Figure 4. HuPrime® PDX HCC Sorafenib resistant tumor DNA was compared with normal liver tissue from a healthy donor for differences in their DNA methylation signature shown as HM: hypermethylated levels for each marker gene. Liver Cancer EpiTect Methyl II PCR Arrays were used to measure CpG island methylation of a panel of 22 tumor suppressor genes involved in HCC development and progression (CCND2, CDH1, CDKN1A, CDKN1B, CDKN2A, DLC1, DLEC1, E2F1, EP300, FHIT, GSTP1, MSH2, MSH3, OPCML, SOCS1, E2F1, RASSF1, RELN, RUNX3, SFRP2, TNFRSF10D, WT1). Results for PDX are shown as the average of 8 individual sorafenib-resistant HCC models vs. methylation levels in healthy liver tissue.
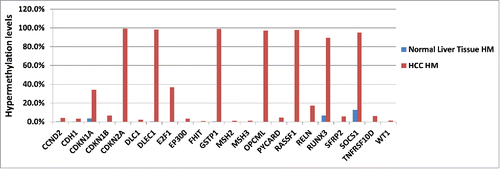
Figure 5. Representative pictures of immunostainings for macroH2A1.1 (m1.1) and macroH2A1.2 (m1.2) in samples from patients diagnosed with hepatocellular carcinoma (HCC), cirrhosis, and steatosis. Bar: 100 μM. All nuclei of tumor cells were positive for either m1.1 or m1.2. Positivity in hepatocytes of cirrhosis and steatosis was significantly lower.
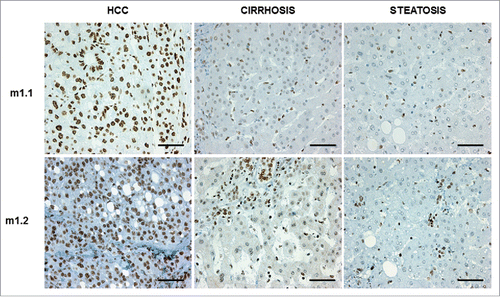
Figure 6. Representative images of HepG2 (A) and Huh-7 cells (B) transgenic for GFP, macroH2A1.1-GFP (macroH2A1.1) and macroH2A1.2-GFP (macroH2A1.2). Images were taken with respective channels for DAPI (blue) and GFP (green). C and D, MTT assay in HepG2 (C) and Huh-7 (D) cells after 72 h with decitabine (decit, 12 μM) or guadecitabine (SGI-110, 1 or 5 μM) incubation. Percentage growth is with untreated GFP control cells. All data were expressed as mean ± standard error of mean (SEM) of 4 independent experiments. *** P < 0.001 vs. untreated GFP-expressing cells. # P < 0.01 and ## P < 0.001 vs. decitabine-treated GFP-expressing cells.
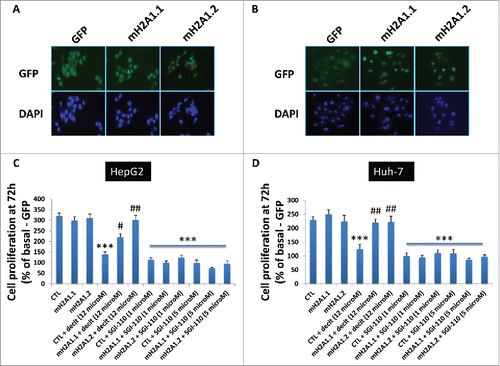
Figure 7. Cytidine deaminase (CDA) levels in HepG2 overexpressing GFP (control), macroH2A1.1 or macroH2A1.2 histone variants. A. CDA mRNA levels were averaged from 3 independent RNA-Seq experiments. B. CDA protein levels were analyzed by immunoblotting. β−actin was used as internal loading control. Representative images of 3 independent experiments are shown. *** P < 0.001 vs. GFP-expressing cells.
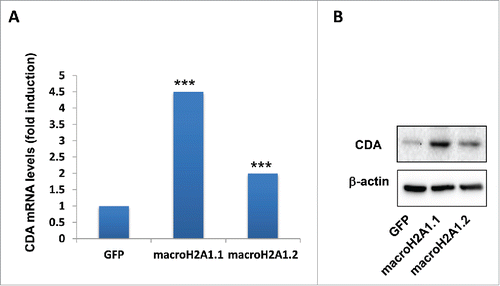
Figure 8. Quantitative methylation-specific PCR of CpG islands of TSG (CDKN2A, DLEC1, and RUNX3) promoters in HCC cells. HepG2 cells (A) and Huh-7 cells (B) stably overexpressing GFP, macroH2A1.1-GFP, or macroH2A1.2-GFP were treated with 1 μM guadecitabine (SGI-110) for 72 h prior to DNA extraction, bisulfite conversion, and processing for qPCR. Primer sequences are shown in . Results are expressed as fold changes of controls (GFP) and as ratios between unmethylated (U) and methylated (M) DNA levels. All data were expressed as mean ± SEM of four independent experiments.* P < 0.05 vs. untreated GFP-expressing cells.
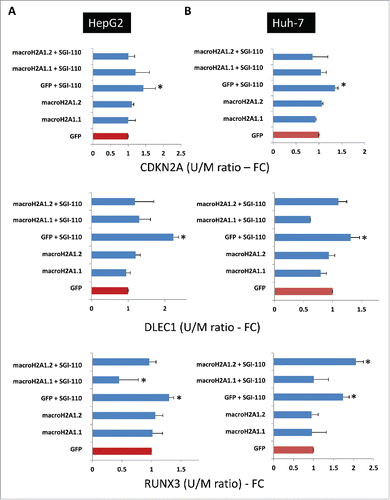
Table 1. qPCR primers for methylated/unmethylated gene promoters. Mf= methylated forward; Mr= methylated reverse; Uf: unmethylated forward; Ur: unmethylated reverse.
